Unlock a world of possibilities! Login now and discover the exclusive benefits awaiting you.
- Qlik Community
- :
- All Forums
- :
- QlikView App Dev
- :
- Re: Selection Indicators in Pivot Table
- Subscribe to RSS Feed
- Mark Topic as New
- Mark Topic as Read
- Float this Topic for Current User
- Bookmark
- Subscribe
- Mute
- Printer Friendly Page
- Mark as New
- Bookmark
- Subscribe
- Mute
- Subscribe to RSS Feed
- Permalink
- Report Inappropriate Content
Selection Indicators in Pivot Table
In a pivot table I want to indicate the reduction in number of orders for a particular Ice Cream.
Accepted Solutions
- Mark as New
- Bookmark
- Subscribe
- Mute
- Subscribe to RSS Feed
- Permalink
- Report Inappropriate Content
Here is my working example.
As you have dimensions across the top this works, if you had dimensions on the left the above() function would do the job.
Richard
QlikCentral.com
- Mark as New
- Bookmark
- Subscribe
- Mute
- Subscribe to RSS Feed
- Permalink
- Report Inappropriate Content
Hi,
You could use the background formatting option in expression to show the day on day change
Create a formula:
if( Sum({<Sales) - Sum({1<[%Date] = {$(Exp_Prev_Date)}> Sales)
> 0
RGB(255,0,0) // Red
,RGB(0,255,0)// Green
)
If you can post your data model on here if you need help with the second expression (Previous Day). Depending on your structure that may need a bit more work.
Richard
qlikcentral.com
- Mark as New
- Bookmark
- Subscribe
- Mute
- Subscribe to RSS Feed
- Permalink
- Report Inappropriate Content
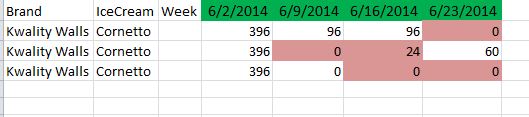
Week is a field name and I have done cross tab to put it horizontally!
In the first week 96 in the next week 0, since there is a reduction 0 is highlighted.
Sorry, I miised week reported column in the original post.
- Mark as New
- Bookmark
- Subscribe
- Mute
- Subscribe to RSS Feed
- Permalink
- Report Inappropriate Content
Try adding the expression
sum(Sales) - before(sum(Sales))
- Mark as New
- Bookmark
- Subscribe
- Mute
- Subscribe to RSS Feed
- Permalink
- Report Inappropriate Content
Here is my working example.
As you have dimensions across the top this works, if you had dimensions on the left the above() function would do the job.
Richard
QlikCentral.com
- Mark as New
- Bookmark
- Subscribe
- Mute
- Subscribe to RSS Feed
- Permalink
- Report Inappropriate Content
Did this answer your question Shannoy?
- Mark as New
- Bookmark
- Subscribe
- Mute
- Subscribe to RSS Feed
- Permalink
- Report Inappropriate Content
Yes, Thank You very much!