Unlock a world of possibilities! Login now and discover the exclusive benefits awaiting you.
- Qlik Community
- :
- All Forums
- :
- QlikView App Dev
- :
- Show percentage in bar chart
- Subscribe to RSS Feed
- Mark Topic as New
- Mark Topic as Read
- Float this Topic for Current User
- Bookmark
- Subscribe
- Mute
- Printer Friendly Page
- Mark as New
- Bookmark
- Subscribe
- Mute
- Subscribe to RSS Feed
- Permalink
- Report Inappropriate Content
Show percentage in bar chart
Hi all,
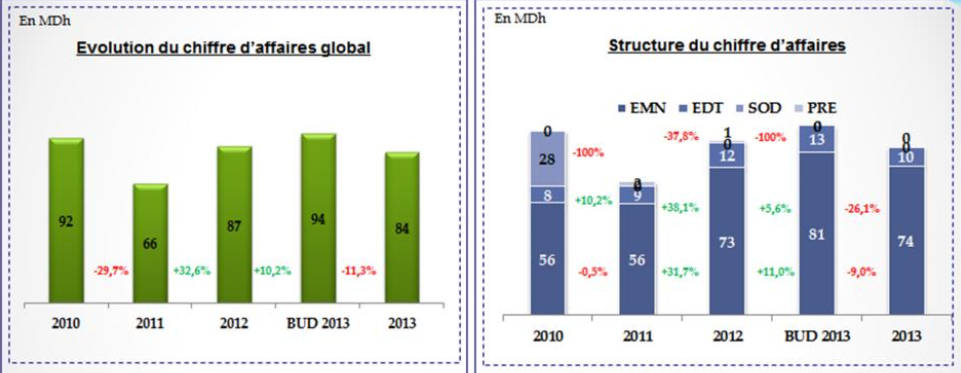
i need to show percentage in a bar chat like the screenshot below, can anyone tell how to do it. the percentage represents the evolution between the bars . For exemple the sales evolution from 2012 to 2011. or the evolution of sales from 2012 for a specific product type to 2013 for the same product type.
please see the screenshot to better understand my needs.
thank you .
- Mark as New
- Bookmark
- Subscribe
- Mute
- Subscribe to RSS Feed
- Permalink
- Report Inappropriate Content
Hi,
I don't think you are going to be able to achieve exactly what you have above.
The only thing i can think is Using text boxes with the correct expressions to calculate the value and placing over the chart, But they won't always line up.
Mark
- Mark as New
- Bookmark
- Subscribe
- Mute
- Subscribe to RSS Feed
- Permalink
- Report Inappropriate Content
thank you for your reply, the problem with text box is that the final user want to export the chart to Excel and i think the text box won't be exported to Excel .
- Mark as New
- Bookmark
- Subscribe
- Mute
- Subscribe to RSS Feed
- Permalink
- Report Inappropriate Content
any help please , how can i acheive the result i want.
Thank you in advance.
- Mark as New
- Bookmark
- Subscribe
- Mute
- Subscribe to RSS Feed
- Permalink
- Report Inappropriate Content
I would suggest you can keep the Percentage below each bar. Add one expression for the Percentage calculation in your bar chart and deselect the Bar checkbox.
Please try this and let me know if it is feasible solution for you.