Unlock a world of possibilities! Login now and discover the exclusive benefits awaiting you.
- Qlik Community
- :
- All Forums
- :
- QlikView App Dev
- :
- Single x-axis label for stacked bar chart / multip...
- Subscribe to RSS Feed
- Mark Topic as New
- Mark Topic as Read
- Float this Topic for Current User
- Bookmark
- Subscribe
- Mute
- Printer Friendly Page
- Mark as New
- Bookmark
- Subscribe
- Mute
- Subscribe to RSS Feed
- Permalink
- Report Inappropriate Content
Single x-axis label for stacked bar chart / multiple line chart
Dear Community,
I try to create a label on the x-axis which define what kind of value is used (track, expected or budget).
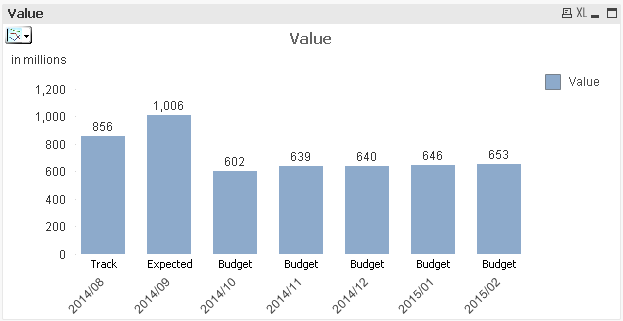
As long I use a single dimension there is no problem to achieve it but I need also the same for stacked bar chart / multiple line chart.
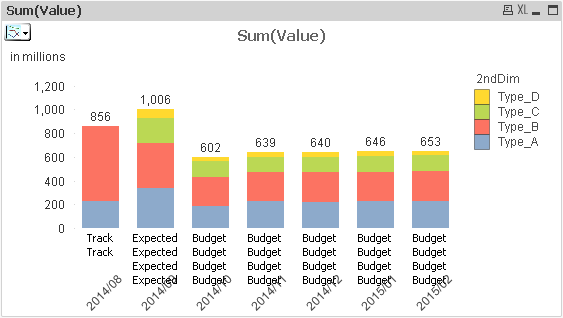
The problem is that my axis label also multiply in accordance amount of my second dimension values. I tried a lot but couldn't achieve a single axis label.
If someone has an idea/advice or a solution how to achieve it please share. Please also let me know when you sure that this can't be achieve.
Some additional infos:
1)In the final application there also x-axis scroll bar is enabled when more than 10 values (1st dimension) are selected,
so using a second object on top of graph isn't an option.
2)In the final application is a list box to switch between different 2nd dimensions which also contain a lot different values,
so using set analysis to create a separate expression is also not possible.
Please feel free to use the attached sample application.
Best Regards,
Ronny
- Mark as New
- Bookmark
- Subscribe
- Mute
- Subscribe to RSS Feed
- Permalink
- Report Inappropriate Content
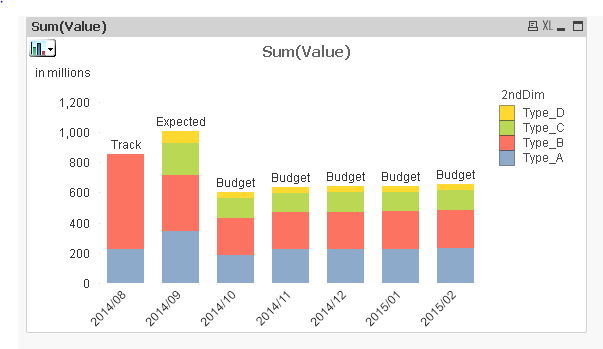
Hi,
Will this be fine for you.
- Mark as New
- Bookmark
- Subscribe
- Mute
- Subscribe to RSS Feed
- Permalink
- Report Inappropriate Content
Hi Jemiah,
Thanks or your fast reply.
Unfortunately not, because for line chart the "Value on data point" setting will create label for each data point.
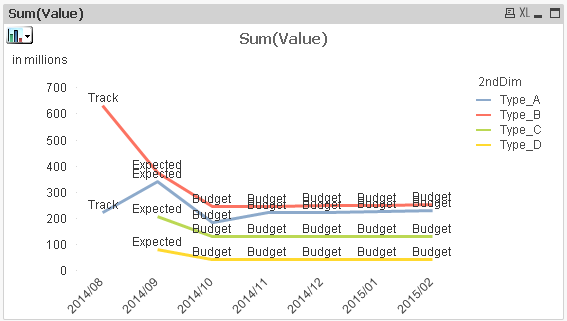
Regards,
Ronny