Unlock a world of possibilities! Login now and discover the exclusive benefits awaiting you.
- Qlik Community
- :
- All Forums
- :
- QlikView App Dev
- :
- Stacked Chart with two sets of Expressions and One...
- Subscribe to RSS Feed
- Mark Topic as New
- Mark Topic as Read
- Float this Topic for Current User
- Bookmark
- Subscribe
- Mute
- Printer Friendly Page
- Mark as New
- Bookmark
- Subscribe
- Mute
- Subscribe to RSS Feed
- Permalink
- Report Inappropriate Content
Stacked Chart with two sets of Expressions and One Dimension
Hi,
I have a stacked bar chart with two sets of expressions which are consisted of StandardPrice and ActualPrice:
Exp1: sum(StandardPrice1),
Exp2: sum(StandardPrice2)
Exp3: sum(StandardPrice3)
Exp4: sum(ActualPrice1)
Exp5: sum(ActualPrice2)
Exp6: sum(ActualPrice3)
On the dimension side I have the Product. However, I just want to display for each dimension two bars, one for the Standards set and the other one for Actual set.
Is there anyway to do that?
Thanks!
- Mark as New
- Bookmark
- Subscribe
- Mute
- Subscribe to RSS Feed
- Permalink
- Report Inappropriate Content
Create a calculated dimension using ValueList():
= ValueList('Actual', 'Standard')
and then build your expressions best on the value of the Valuelist:
If ( ValueList('Actual', 'Standard') = 'Actual', ...
- Mark as New
- Bookmark
- Subscribe
- Mute
- Subscribe to RSS Feed
- Permalink
- Report Inappropriate Content
As oleg said, why cant you try like this?
- Mark as New
- Bookmark
- Subscribe
- Mute
- Subscribe to RSS Feed
- Permalink
- Report Inappropriate Content
Well, I've tried the ValueList as this code:
if(ValueList('Standard','Actual')='Standard',
sum(StandardPrice1)+sum(StandardPrice2)+sum(StandardPrice3),
if(ValueList('Standard','Actual')='Actual',
sum(ActualPrice1)+sum(ActualPrice2)+sum(ActualPrice3)
))
But the first problem that it's summing up all the standard prices and display them in the same bar and same for the Actual. What I need is to keep them segregated but stacked on the same bar. The second problem is with the dimensions, because originally I have the Product dimension and I added another one for the ValueList, so it's now taking the ValueList dimension and listing the Prodution dim on the bars.
- Mark as New
- Bookmark
- Subscribe
- Mute
- Subscribe to RSS Feed
- Permalink
- Report Inappropriate Content
Let me address your questions one by one:
<<<But the first problem that it's summing up all the standard prices and display them in the same bar and same for the Actual. What I need is to keep them segregated but stacked on the same bar.>>>
You should get them segregated based on your second dimension (Product).
<<<The second problem is with the dimensions, because originally I have the Product dimension and I added another one for the ValueList, so it's now taking the ValueList dimension and listing the Prodution dim on the bars.>>>
It sounds like you wanted to have bars for Products and stack Std/Act for each product ? If that's the case, promote Product to be the first Dimension and leave the ValueList as the second.
Having said that, I don't think you should stack Standard and Actual, from the logical standpoint. These two measures should not be summarized, but rather compared. I'd think of something like this:
Expression 1: the lower between the Std and the Actual:
RangeMin(Standard, Actual)
Expression 2: the difference between the higher and the lower value
RangeMax(Standard, Actual) - RangeMin(Standard, Actual)
Expression 1 should have a static color, while Expression 2 should have a calculated color - if Standard>Actual, use the same color as Standard, otherwise, use the same color as Actual.
In this case, you may not need the valuelist at all...
cheers,
Oleg Troyansky
www.masterssummit.com - take your QlikView skills to the next level!
- Mark as New
- Bookmark
- Subscribe
- Mute
- Subscribe to RSS Feed
- Permalink
- Report Inappropriate Content
<<It sounds like you wanted to have bars for Products and stack Std/Act for each product ? >>
No, I want two bars for each Product, one for the STD and another one for ACT. But so far I'm only getting the dimensions according to the promoted ones (either two bars for STD/ACT when using ValueList and the Product is on the bar, or vice versa).
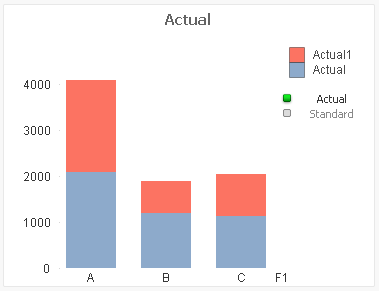
So first of all, how can I get the chart as a bar for STD that shows StandardPrice1,2,3 stacked but segregated and same thing for the second ACT bar.
Second thing is having these two bars (ACT/STD) for each Product dimension?
Thanks
- Mark as New
- Bookmark
- Subscribe
- Mute
- Subscribe to RSS Feed
- Permalink
- Report Inappropriate Content
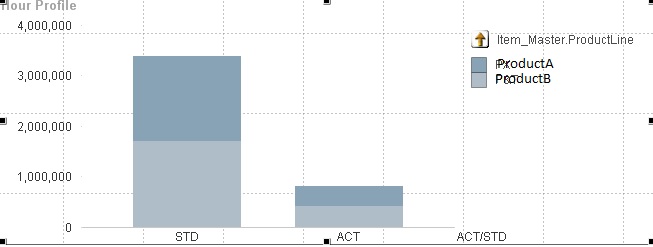
OK, now I understand better what you are trying to do, and I don't think it's possible... You want to have 2 bars for each Product (which is called a Grouped Bar Chart). Then, each one of the two bars should be broken into section by cost components 1, 2, 3 (which is called a Stacked Bar Chart).
In QlikView, a Bar Chart can be either Grouped or Stacked, but not both.
The only work around I can think of is generating a synthetic dimension that would be a combination of Product and Act/Std. Then you are down to one dimension and you can use a regular Stacked chart. However, the distance between the bars will be identical.
sorry, that's all I can think of...