Unlock a world of possibilities! Login now and discover the exclusive benefits awaiting you.
- Qlik Community
- :
- All Forums
- :
- QlikView App Dev
- :
- Stacked charts - multiple stacks
- Subscribe to RSS Feed
- Mark Topic as New
- Mark Topic as Read
- Float this Topic for Current User
- Bookmark
- Subscribe
- Mute
- Printer Friendly Page
- Mark as New
- Bookmark
- Subscribe
- Mute
- Subscribe to RSS Feed
- Permalink
- Report Inappropriate Content
Stacked charts - multiple stacks
I am new to QlikView and I am trying to create a stacked chart which contains two stacks - the first is a stack of 2 values from a table (actual cost and out-turn cost) and compares this to a second stack with a single value (full year budget cost) from the same table.
This seems a simple concept but I cannot find anything within the chart Properties to accommodate this. I suspect my inability to produce this view is down to my inexperience of using QlikView.
Any help would be appreciated.
Thanks.
Accepted Solutions
- Mark as New
- Bookmark
- Subscribe
- Mute
- Subscribe to RSS Feed
- Permalink
- Report Inappropriate Content
Hi, thanks for the suggestion. I have now managed to resolve this myself via the following method.
1) I edited the load script as follows -
load * inline [
Type
Budget Full Year
Actual + Out-turn
];
2) Under the definition for each expression I entered the following
Actual Cost : =if(Type='Actual + Out-turn',sum([Actual Cost]))
Outturn : =if(Type='Actual + Out-turn',(sum([Outturn])-sum([Actual Cost])))
Budget Cost : =if(Type='Budget Full Year',sum ([Budget Cost]))
3) Set Accumulation on each expression to No Accumulation
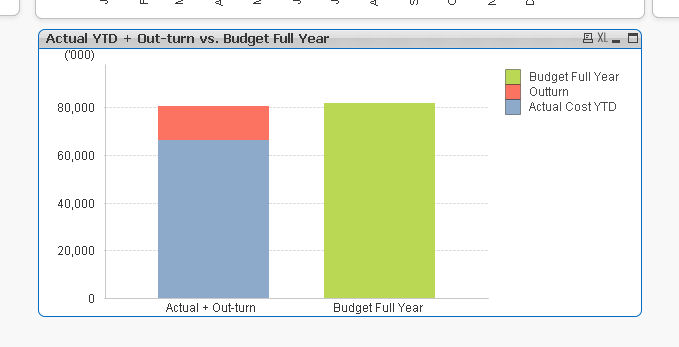
This gives me what I need.
Thanks.
- Mark as New
- Bookmark
- Subscribe
- Mute
- Subscribe to RSS Feed
- Permalink
- Report Inappropriate Content
Please attach a screenshot or a sample app.
The bar chart gives an option to either group the bars or stack them and not a combination of both. You may want to explore other options using Combo chart.
- Mark as New
- Bookmark
- Subscribe
- Mute
- Subscribe to RSS Feed
- Permalink
- Report Inappropriate Content
Hi
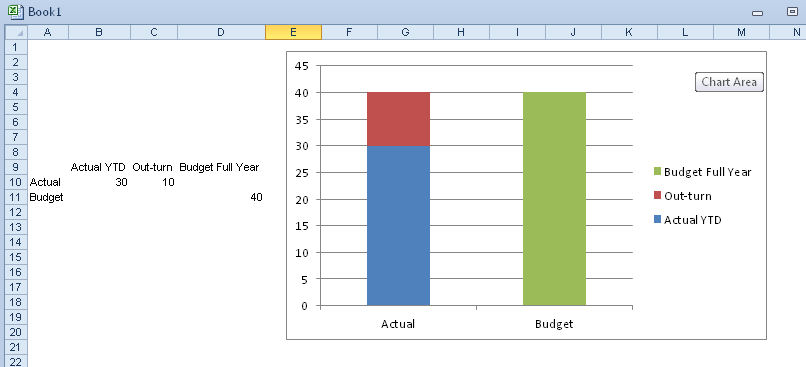
Thanks for the reply. I've attached a screenshot of how this would look in excel.
Currently, the values I would like to use are stored in the same table in QlikView.
Thanks.
- Mark as New
- Bookmark
- Subscribe
- Mute
- Subscribe to RSS Feed
- Permalink
- Report Inappropriate Content
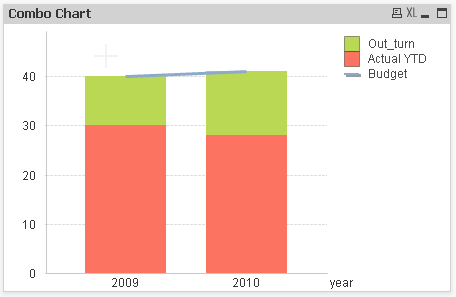
You can try using the combo chart with budget as a line plot and the Actual and Out_turn as the stacked bar charts.
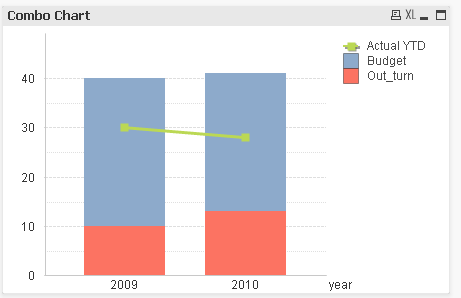
Or the Actual YTD as a line plot while budget and out-turn are stacked as below:
- Mark as New
- Bookmark
- Subscribe
- Mute
- Subscribe to RSS Feed
- Permalink
- Report Inappropriate Content
Hi, thanks for the suggestion. I have now managed to resolve this myself via the following method.
1) I edited the load script as follows -
load * inline [
Type
Budget Full Year
Actual + Out-turn
];
2) Under the definition for each expression I entered the following
Actual Cost : =if(Type='Actual + Out-turn',sum([Actual Cost]))
Outturn : =if(Type='Actual + Out-turn',(sum([Outturn])-sum([Actual Cost])))
Budget Cost : =if(Type='Budget Full Year',sum ([Budget Cost]))
3) Set Accumulation on each expression to No Accumulation
This gives me what I need.
Thanks.