Unlock a world of possibilities! Login now and discover the exclusive benefits awaiting you.
- Qlik Community
- :
- All Forums
- :
- QlikView App Dev
- :
- Re: Stacked dots in combo chart
- Subscribe to RSS Feed
- Mark Topic as New
- Mark Topic as Read
- Float this Topic for Current User
- Bookmark
- Subscribe
- Mute
- Printer Friendly Page
- Mark as New
- Bookmark
- Subscribe
- Mute
- Subscribe to RSS Feed
- Permalink
- Report Inappropriate Content
Stacked dots in combo chart
Hi all,
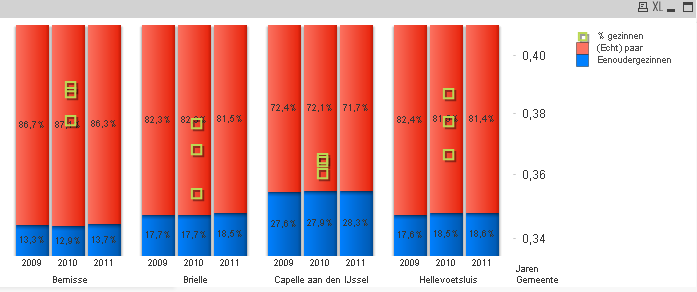
I have a combo charts which has 2 dimensions; cities and years. So for every city I want to see the multiple years.
Furthermore I have 3 expression, 2 which are a stacked bar and the 3rd should be a dot which represents an other percentage.
But because off the 2 dimensions it also stacks the dots for the 3rd expression. Could anyone help how to fix this?
Regards,
Paul
- Mark as New
- Bookmark
- Subscribe
- Mute
- Subscribe to RSS Feed
- Permalink
- Report Inappropriate Content
Hello Paul,
I am having almost exactly the same problem. Did you ever find a solution?
- Mark as New
- Bookmark
- Subscribe
- Mute
- Subscribe to RSS Feed
- Permalink
- Report Inappropriate Content
Have you tried using a trellis chart? This way one dimension is used to draw different charts and the visual effect could be similar.
- Mark as New
- Bookmark
- Subscribe
- Mute
- Subscribe to RSS Feed
- Permalink
- Report Inappropriate Content
Hi Paul.
I don´t know if it's possible to select only "stacking" for some expressions and not for others (I think isn't possible)
You could use arithmetic operations for get the result you want. For example:
Expr1: Sum(Cost)/sum(Total Cost)
Expr2: Sum(Rent)/sum(Total Rent) (this will stack these two expressions)
Expr3: Sum(Obj)/Sum(Total Obj)-Expr1-Expr2 (this will stack Expr3 with Expr1 and Expr2, but then you will get only the value for the Expr3)
Try it