Unlock a world of possibilities! Login now and discover the exclusive benefits awaiting you.
- Qlik Community
- :
- All Forums
- :
- QlikView App Dev
- :
- Re: Straight Line in Line Chart
- Subscribe to RSS Feed
- Mark Topic as New
- Mark Topic as Read
- Float this Topic for Current User
- Bookmark
- Subscribe
- Mute
- Printer Friendly Page
- Mark as New
- Bookmark
- Subscribe
- Mute
- Subscribe to RSS Feed
- Permalink
- Report Inappropriate Content
Straight Line in Line Chart
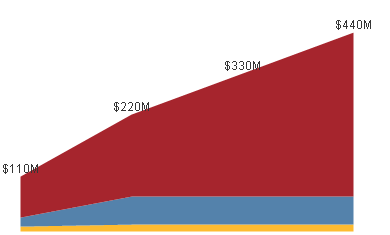
Hello, I have a line chart where i have amounts in yellow and blue that i want stacked. However, I need to make the third expression, which is the target, a straight line instead of stacking on top. How can I achieve this?
Thanks in advance!
-Jason
Accepted Solutions
- Mark as New
- Bookmark
- Subscribe
- Mute
- Subscribe to RSS Feed
- Permalink
- Report Inappropriate Content
If the target line is the same value for every dimension value on the x-axis then you can use a reference line which you can add on the Presentation tab. Other wise you either have to use two charts and put them on top of each other. Or you'll have to do a lot of calculating to create expressions that result in correctly stacked areas. The combo chart doesn't support areas + line(s).
talk is cheap, supply exceeds demand
- Mark as New
- Bookmark
- Subscribe
- Mute
- Subscribe to RSS Feed
- Permalink
- Report Inappropriate Content
Apologies for the earlier comment that I had to delete. I'm struggling to use a reference line to recreate the target. My dimension is Quarter and has values of Q1 - Q4. I tried using the following expression to create the line but it is not working: =right([Quarter],1) * 110
- Mark as New
- Bookmark
- Subscribe
- Mute
- Subscribe to RSS Feed
- Permalink
- Report Inappropriate Content
A reference line can have only a constant value. If you use an expression for the reference line then it can return only one value. It will be calculated at the chart level, not at the level of dimension values.
talk is cheap, supply exceeds demand
- Mark as New
- Bookmark
- Subscribe
- Mute
- Subscribe to RSS Feed
- Permalink
- Report Inappropriate Content
Got it, thank you!
- Mark as New
- Bookmark
- Subscribe
- Mute
- Subscribe to RSS Feed
- Permalink
- Report Inappropriate Content
Thanks Gysbert! I ended up stacking a chart on top.
-Jason