Unlock a world of possibilities! Login now and discover the exclusive benefits awaiting you.
- Qlik Community
- :
- All Forums
- :
- QlikView App Dev
- :
- Struggling with time graph
- Subscribe to RSS Feed
- Mark Topic as New
- Mark Topic as Read
- Float this Topic for Current User
- Bookmark
- Subscribe
- Mute
- Printer Friendly Page
- Mark as New
- Bookmark
- Subscribe
- Mute
- Subscribe to RSS Feed
- Permalink
- Report Inappropriate Content
Struggling with time graph
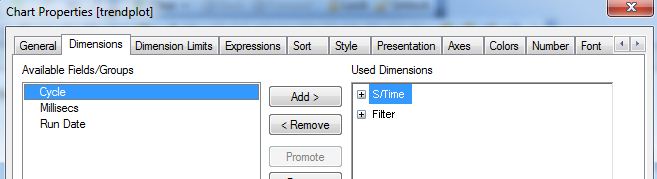
For some reason i am having a problem with creating the graph i want:-
We are running speed tests on system performance and want to graph 2 different locations where the test runs on the same day.
Test 1 runs from 10 - 12.40
Test 2 runs from 11.30 - 18.30
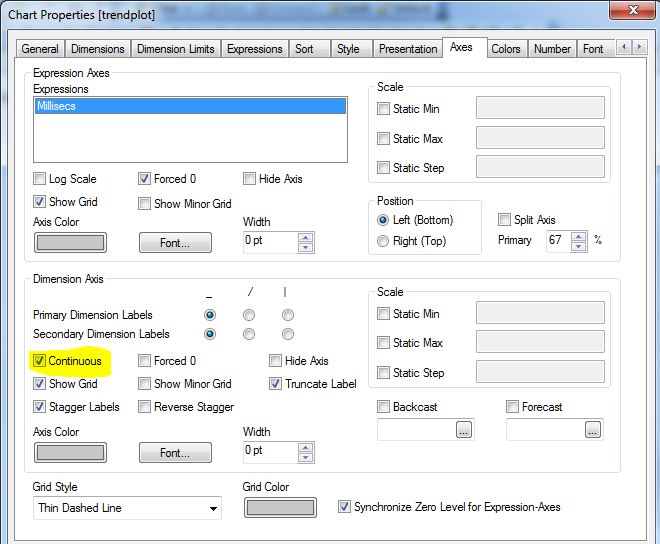
How do i get the 2 lines on a graph where the scale is between min and max times ie 10 - 18.30
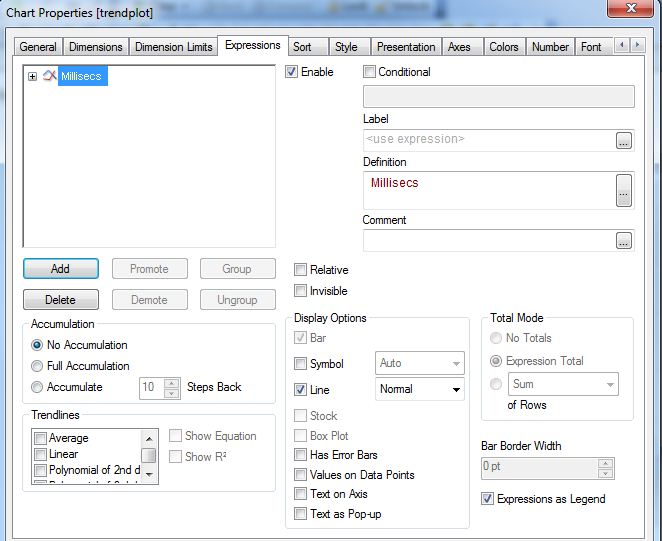
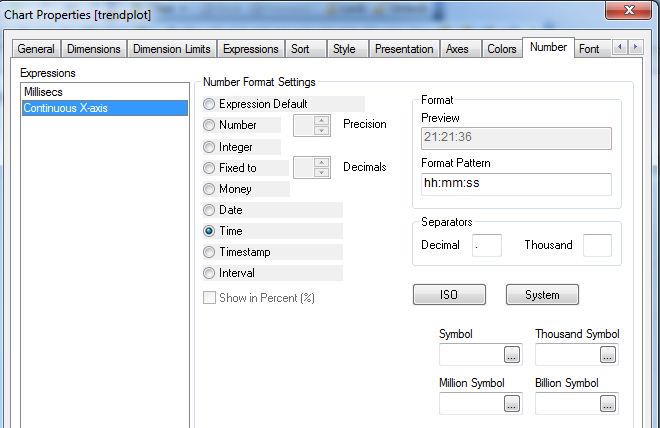
The y Axis should be millisecs / 1000
The x axis should be s time
Any help gratefully received
Thanks in advance
test data file enclosed
Accepted Solutions
- Mark as New
- Bookmark
- Subscribe
- Mute
- Subscribe to RSS Feed
- Permalink
- Report Inappropriate Content
- Mark as New
- Bookmark
- Subscribe
- Mute
- Subscribe to RSS Feed
- Permalink
- Report Inappropriate Content
Hi,
seems to work out of the box:
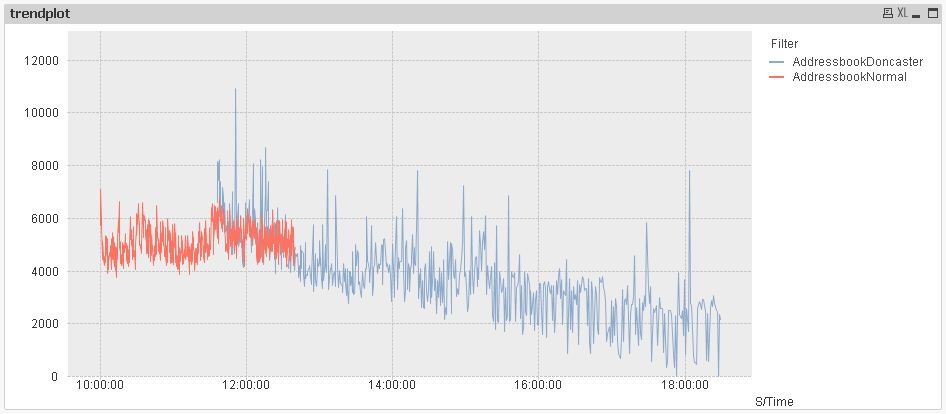
hope this helps
regards
Marco
- Mark as New
- Bookmark
- Subscribe
- Mute
- Subscribe to RSS Feed
- Permalink
- Report Inappropriate Content
Thanks Marco - that answer was perfect.
I need to explore graph options more i think !
- Mark as New
- Bookmark
- Subscribe
- Mute
- Subscribe to RSS Feed
- Permalink
- Report Inappropriate Content
You're welcome
regards
Marco