Unlock a world of possibilities! Login now and discover the exclusive benefits awaiting you.
- Qlik Community
- :
- All Forums
- :
- QlikView App Dev
- :
- Re: Stuck: How to design a monthly Actual and Fore...
- Subscribe to RSS Feed
- Mark Topic as New
- Mark Topic as Read
- Float this Topic for Current User
- Bookmark
- Subscribe
- Mute
- Printer Friendly Page
- Mark as New
- Bookmark
- Subscribe
- Mute
- Subscribe to RSS Feed
- Permalink
- Report Inappropriate Content
Stuck: How to design a monthly Actual and Forecast table like this in QlikView user interface?
Hello,
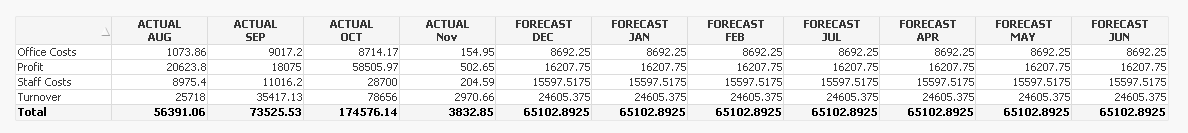
Our money department has asked for a table like this:
| Actual | Actual | Actual | Actual | Actual | Actual | Forecast | Forecast | Forecast | Forecast | Forecast | Forecast | ||
| Month1 | Month2 | Month3 | Month4 | Month5 | Month6 | Month7 | Month8 | Month9 | Month10 | Month11 | Month12 | Total | |
| Turnover | |||||||||||||
| Profit | |||||||||||||
| Staff Costs | |||||||||||||
| Office Costs | |||||||||||||
| Total |
The logic is:
Show the actual costs for the previous month, any months after show the Forecast values.
I have the necessary fields such as:
Field identifying Actual or Budget
Month1, Month2 etc are in Master Calendar
Turnover etc values are also available.
But I am stuck and not sure actually how to design the above kind of table in the user interface.
Could anyone please share an example?
- Mark as New
- Bookmark
- Subscribe
- Mute
- Subscribe to RSS Feed
- Permalink
- Report Inappropriate Content
I would suggest trying to get your users to move away from straight tables like what you're showing here. It's easier to spot trends in a quick bar chart. I have a screen shot below (from Qlik Sense) where I am showing year-to-date sales against prior year sales with forecast only showing from previous month forward. Each has a separate expression and the forecast data I am only bringing in the previous month forward, so there are not any historical values. If you have to have historical values, then I would suggest using set analysis in your expression to only show future months.

- Mark as New
- Bookmark
- Subscribe
- Mute
- Subscribe to RSS Feed
- Permalink
- Report Inappropriate Content
To complete the chart, you will need to do below.
There are two dimensions
One for Month field
Another one to show either 'Actual/Forecast' (You need a condition to show actual or not based on current date)
There are 4 (Actual + Forecast) expressions for below 4 rows
Turnover
Profit
Staff Costs
Office Costs
- Mark as New
- Bookmark
- Subscribe
- Mute
- Subscribe to RSS Feed
- Permalink
- Report Inappropriate Content
Hi there and everyone reading this,
Thanks for tying to help.
Fields I have:
I have the Month field:
Values are Month1, Month2 etc
The Months run from April to March, so in a real world example we would currently be in Month12.
For the Actual / Forecast, currently these two values reside in a "FigureType" field where the values are "Forecast" or Actual".
Logic I want to build:
Show Actual numbers for all the months before the current month, else for all the months from the current month, show the Forecast values.
So in a real world exaple it would be show me the Actual values for all the months Month11 to Month1, and show Forecast for Month12.
How can I do this?
I am working with accountants and they only want to see this in the original table format like my original post.
The data is sensitive so unfortunately I cannot share a sample here.
- Mark as New
- Bookmark
- Subscribe
- Mute
- Subscribe to RSS Feed
- Permalink
- Report Inappropriate Content
In your script you can copy the forecast and actual numbers into separate columns. In your pivot table create an expression for actual and another expression for forecast. Turn off the option to show zero values. That may give you what you need.
- Mark as New
- Bookmark
- Subscribe
- Mute
- Subscribe to RSS Feed
- Permalink
- Report Inappropriate Content
Please find the attached sample qvw.
Hopefully this helps you.
- Mark as New
- Bookmark
- Subscribe
- Mute
- Subscribe to RSS Feed
- Permalink
- Report Inappropriate Content
I created another sample which meets your requirement more.

Hopefully you like it.