Unlock a world of possibilities! Login now and discover the exclusive benefits awaiting you.
- Qlik Community
- :
- All Forums
- :
- QlikView App Dev
- :
- Sum by Month,
- Subscribe to RSS Feed
- Mark Topic as New
- Mark Topic as Read
- Float this Topic for Current User
- Bookmark
- Subscribe
- Mute
- Printer Friendly Page
- Mark as New
- Bookmark
- Subscribe
- Mute
- Subscribe to RSS Feed
- Permalink
- Report Inappropriate Content
Sum by Month,
New to QV, 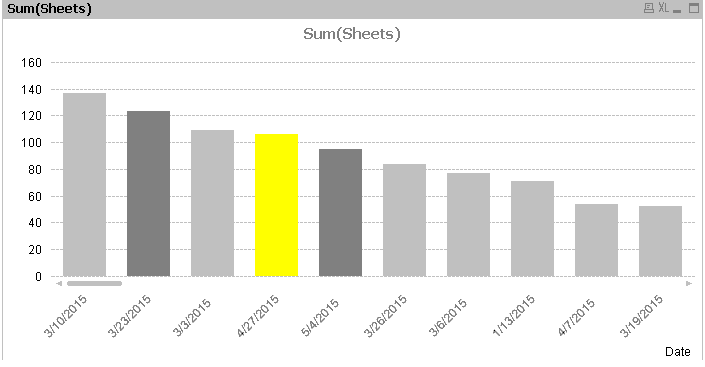
My bar chart shows sum of sheets per day, How do i change the chart to show the sum of sheets per month?
Excel sheet with the sample data is attached. Any help would be nice.
Accepted Solutions
- Mark as New
- Bookmark
- Subscribe
- Mute
- Subscribe to RSS Feed
- Permalink
- Report Inappropriate Content
Hi Kiran,
change script to
Data:
LOAD Date(Date) as Date,
Month(Date) as Month,
Sheets,
COMPANY
FROM
(ooxml, embedded labels, table is Sheet1);
Adding the Month Section, then you get:

With Month as the dimension and Sum(Sheets) as the expression
HTH Andy
- Mark as New
- Bookmark
- Subscribe
- Mute
- Subscribe to RSS Feed
- Permalink
- Report Inappropriate Content
When you load data.xlsx add a new field,
Load
...
Year(Data)*100+Month(data) as YM
Resident
...
YM represent the union of year and month eg. 201504, use that field as dimension ...
let me know
- Mark as New
- Bookmark
- Subscribe
- Mute
- Subscribe to RSS Feed
- Permalink
- Report Inappropriate Content
Add to your Script this line
month(Date) as Month,
and then use this new Field as your Dimension
- Mark as New
- Bookmark
- Subscribe
- Mute
- Subscribe to RSS Feed
- Permalink
- Report Inappropriate Content
Hi Kiran,
change script to
Data:
LOAD Date(Date) as Date,
Month(Date) as Month,
Sheets,
COMPANY
FROM
(ooxml, embedded labels, table is Sheet1);
Adding the Month Section, then you get:
With Month as the dimension and Sum(Sheets) as the expression
HTH Andy
- Mark as New
- Bookmark
- Subscribe
- Mute
- Subscribe to RSS Feed
- Permalink
- Report Inappropriate Content
Or if you can't change the script you can create a calculated dimension in your chart, using the expression =month(Date), with label Month and use the same expression.
This will aggregate the sheets by Month
Less efficient that changing the script though, so if you have the option, go for the script change.
- Mark as New
- Bookmark
- Subscribe
- Mute
- Subscribe to RSS Feed
- Permalink
- Report Inappropriate Content
Thank you Andrew.. it worked.
- Mark as New
- Bookmark
- Subscribe
- Mute
- Subscribe to RSS Feed
- Permalink
- Report Inappropriate Content
Thank you Robert
- Mark as New
- Bookmark
- Subscribe
- Mute
- Subscribe to RSS Feed
- Permalink
- Report Inappropriate Content
Thank you Agis, all the suggestions worked.