Unlock a world of possibilities! Login now and discover the exclusive benefits awaiting you.
- Qlik Community
- :
- All Forums
- :
- QlikView App Dev
- :
- Symbol Chart shown as Line in Qlikview
Options
- Subscribe to RSS Feed
- Mark Topic as New
- Mark Topic as Read
- Float this Topic for Current User
- Bookmark
- Subscribe
- Mute
- Printer Friendly Page
Turn on suggestions
Auto-suggest helps you quickly narrow down your search results by suggesting possible matches as you type.
Showing results for
Creator
2018-04-09
03:26 AM
- Mark as New
- Bookmark
- Subscribe
- Mute
- Subscribe to RSS Feed
- Permalink
- Report Inappropriate Content
Symbol Chart shown as Line in Qlikview
Hi All,
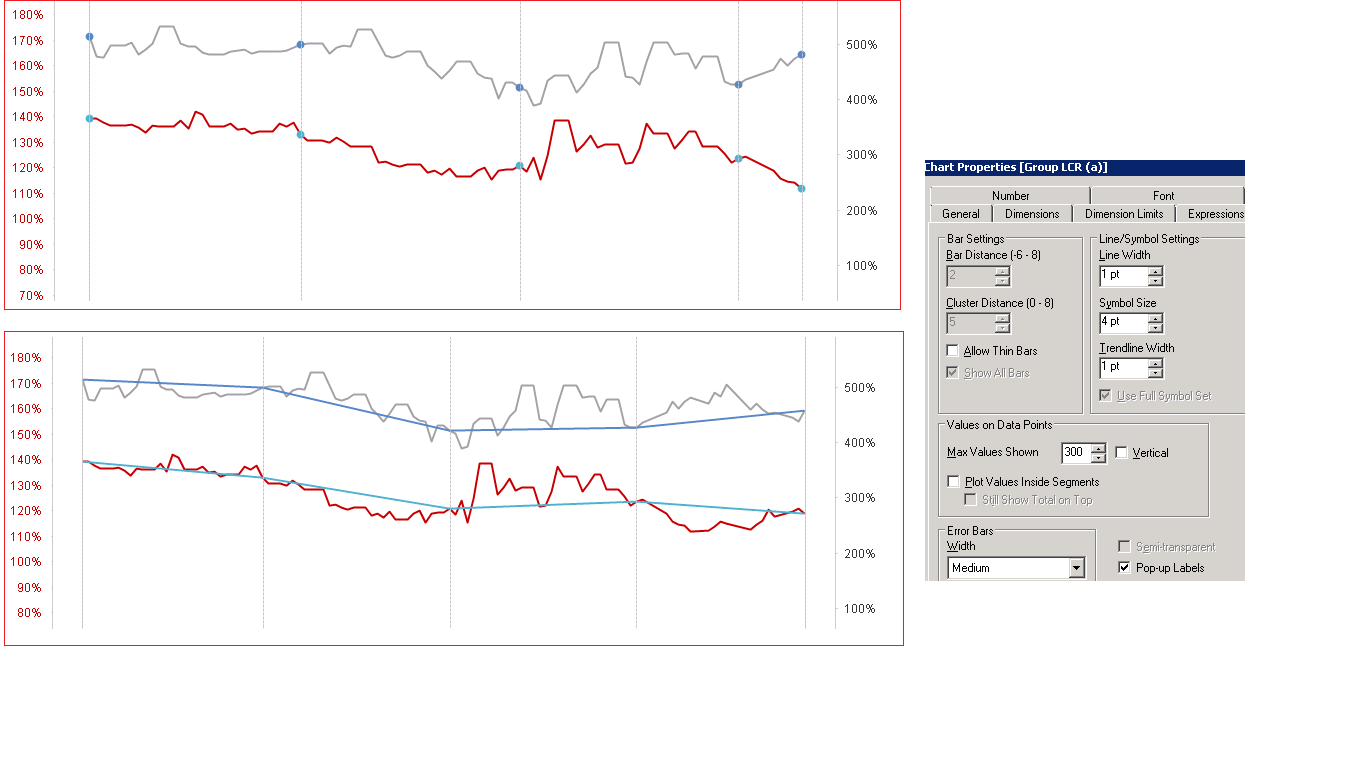
I have a Combo Chart in Qlikview where i Show Symbol for one my expression. If the number of data points increase the symbols are shown as line.
I have tried to increase the Max values shown in the "Value on Data Points" section.
Also,tried to change the "Max Symbols in Charts" (Settings ->User Preferences -> Objects - This solution helps on desktop version but not on accesspoint)
Please advise if any solution to show it as symbol on the accesspoint.
Thanks!
822 Views
1 Solution
Accepted Solutions
MVP
2018-04-09
08:33 AM
- Mark as New
- Bookmark
- Subscribe
- Mute
- Subscribe to RSS Feed
- Permalink
- Report Inappropriate Content
There is an equivalent setting within the qmc by system/performance.
- Marcus
728 Views
1 Reply
MVP
2018-04-09
08:33 AM
- Mark as New
- Bookmark
- Subscribe
- Mute
- Subscribe to RSS Feed
- Permalink
- Report Inappropriate Content
There is an equivalent setting within the qmc by system/performance.
- Marcus
729 Views