Unlock a world of possibilities! Login now and discover the exclusive benefits awaiting you.
- Qlik Community
- :
- All Forums
- :
- QlikView App Dev
- :
- Total expression in Pivot Table with variable colu...
- Subscribe to RSS Feed
- Mark Topic as New
- Mark Topic as Read
- Float this Topic for Current User
- Bookmark
- Subscribe
- Mute
- Printer Friendly Page
- Mark as New
- Bookmark
- Subscribe
- Mute
- Subscribe to RSS Feed
- Permalink
- Report Inappropriate Content
Total expression in Pivot Table with variable columns
Hi ppl!
I'm trying to make a column that Totals the rows of a pivot table (which will never be collapsed) but may have different number of expressions active depending on some conditions. I've put these conditions in the conditional field in the expression label.
the difficult thing here is that while I could make an expression:
column(1) + column(2)...
this expression would only fit the purpose if the columns were static; but they aren't and when QV tries to find a column that is not currently there I get a '-' as a result.
A way of solving this, would be to place all the conditions (one for each months) in the expression that sums the total, but I REALLY don't want to do this because it feels like a "machetazo" (making the code work by brutally stuffing it with IFs)
Logic behind the analysis =>
the only column that is fixed to an "always show" condition is the first one that shows me the YTD (Year to Date) Sales, and the others are supposed to be the budgets of the coming months, so as to get the estimate at the end of the year sales I should sum up the YTD with all the budgets for the coming months.
heres the table I have when I select all the months from April through Sept.
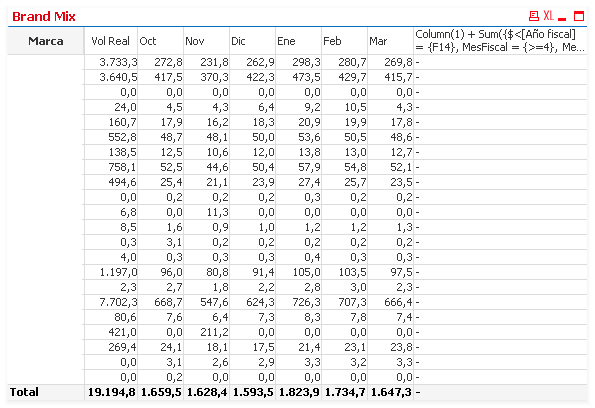
where the result in the first row should be around 5345....
thank you for your time!
Accepted Solutions
- Mark as New
- Bookmark
- Subscribe
- Mute
- Subscribe to RSS Feed
- Permalink
- Report Inappropriate Content
'Sup Michael,
I don't need to see the totals in each column but in each row (at the most right) because the main dimension is "Brand", and the idea here is to see the estimated brand sales at the end of the year.
in other topics,,, I solved it :
Sum({$<[Año fiscal] = {$(= 'F' & (vMaxYear - 1999))}, Mes = , MesFiscal = {">$(vMaxFiscalMonth)"}>} BudgetRegion)
here, [Año fiscal] is the fiscal year, so the result here is simply a sum of all the budgets for that year that have a month which is after the maximum selected fiscal month (which stores a 1 for april, 2 for may and so forth...)
so I added Column(1) (which was the YTD) to the previous expression and that would be the estimated total sales per brand
thank you for your suggestion though Michael
- Mark as New
- Bookmark
- Subscribe
- Mute
- Subscribe to RSS Feed
- Permalink
- Report Inappropriate Content
Not sure why it is a problem. If it is really a pivot, and YTD, Oct, Nov ... are all values of the same dimension (are they?) - you just use "show partial total" for the top dimension.
Regards,
Michael
- Mark as New
- Bookmark
- Subscribe
- Mute
- Subscribe to RSS Feed
- Permalink
- Report Inappropriate Content
'Sup Michael,
I don't need to see the totals in each column but in each row (at the most right) because the main dimension is "Brand", and the idea here is to see the estimated brand sales at the end of the year.
in other topics,,, I solved it :
Sum({$<[Año fiscal] = {$(= 'F' & (vMaxYear - 1999))}, Mes = , MesFiscal = {">$(vMaxFiscalMonth)"}>} BudgetRegion)
here, [Año fiscal] is the fiscal year, so the result here is simply a sum of all the budgets for that year that have a month which is after the maximum selected fiscal month (which stores a 1 for april, 2 for may and so forth...)
so I added Column(1) (which was the YTD) to the previous expression and that would be the estimated total sales per brand
thank you for your suggestion though Michael