Unlock a world of possibilities! Login now and discover the exclusive benefits awaiting you.
- Qlik Community
- :
- All Forums
- :
- QlikView App Dev
- :
- Re: Total for specific dimension?
- Subscribe to RSS Feed
- Mark Topic as New
- Mark Topic as Read
- Float this Topic for Current User
- Bookmark
- Subscribe
- Mute
- Printer Friendly Page
- Mark as New
- Bookmark
- Subscribe
- Mute
- Subscribe to RSS Feed
- Permalink
- Report Inappropriate Content
Total for specific dimension?
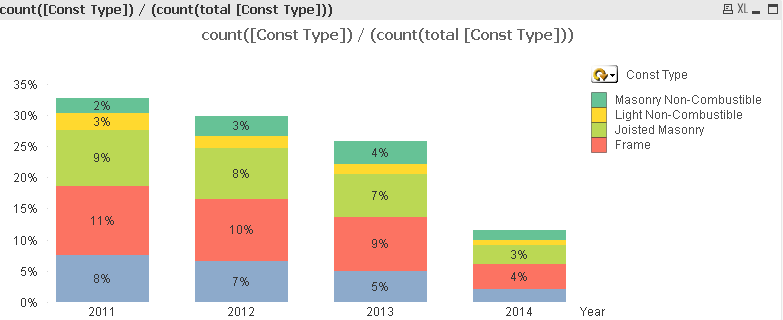
I want each column in this graph to have the same height - i.e. each column should add up to 100%. The problem is that the Total attribute counts every record for EVERY year, but I just want it to count the total for each year. Any suggestions on how to do this?
Accepted Solutions
- Mark as New
- Bookmark
- Subscribe
- Mute
- Subscribe to RSS Feed
- Permalink
- Report Inappropriate Content
- Mark as New
- Bookmark
- Subscribe
- Mute
- Subscribe to RSS Feed
- Permalink
- Report Inappropriate Content
Try:
count([Const Type]) / (count(total <Year> [Const Type]))
Hope this helps!
- Mark as New
- Bookmark
- Subscribe
- Mute
- Subscribe to RSS Feed
- Permalink
- Report Inappropriate Content
Nope, it still produces the same graph 
- Mark as New
- Bookmark
- Subscribe
- Mute
- Subscribe to RSS Feed
- Permalink
- Report Inappropriate Content
Hello Andy,
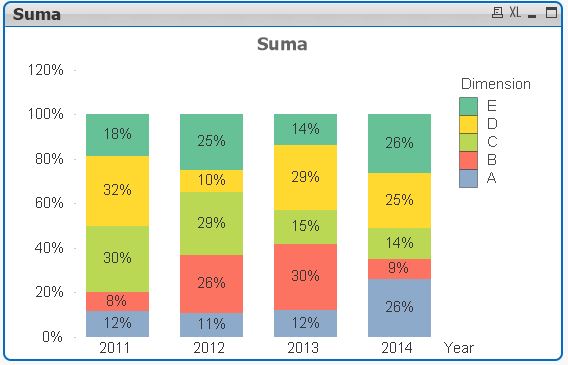
See the attachement, may be is what you need...
Regards,
- Mark as New
- Bookmark
- Subscribe
- Mute
- Subscribe to RSS Feed
- Permalink
- Report Inappropriate Content
I have to use Count instead of Sum like you used, but for some reason that still isn't working with my data set. You used the same method to Jeremiah recommended, but for some reasoning the <Year> modifier isn't doing anything on my data. Any idea what would cause this behavior?
- Mark as New
- Bookmark
- Subscribe
- Mute
- Subscribe to RSS Feed
- Permalink
- Report Inappropriate Content
This is weird - I copy and pasted your graph into my QlikView and then modified the expression, and now it works! However, when I copy/paste the expression into my chart, it does not work. Do you know if there's a setting that could cause this?
- Mark as New
- Bookmark
- Subscribe
- Mute
- Subscribe to RSS Feed
- Permalink
- Report Inappropriate Content
On the expressions tab, uncheck the "Relative" option... may be it is...
- Mark as New
- Bookmark
- Subscribe
- Mute
- Subscribe to RSS Feed
- Permalink
- Report Inappropriate Content
Nope, that wasn't checked. I flipped through all of the tabs in the chart properties and couldn't find anything that seemed logical. This is certainly a mystery haha
- Mark as New
- Bookmark
- Subscribe
- Mute
- Subscribe to RSS Feed
- Permalink
- Report Inappropriate Content
I believe that you must have accidentally "detached" your chart (right click -> detach). When you do this, when you change the expression, the chart wont update the new change. If you then attach it again (right click -> attach), the changes to the expression should now work.
- Mark as New
- Bookmark
- Subscribe
- Mute
- Subscribe to RSS Feed
- Permalink
- Report Inappropriate Content
It wasn't detached either, I checked for that too 
When I create a graph from scratch I still get my original problem. I'm using QlikView 11.