Unlock a world of possibilities! Login now and discover the exclusive benefits awaiting you.
- Qlik Community
- :
- All Forums
- :
- QlikView App Dev
- :
- Re: Total line type in line chart
- Subscribe to RSS Feed
- Mark Topic as New
- Mark Topic as Read
- Float this Topic for Current User
- Bookmark
- Subscribe
- Mute
- Printer Friendly Page
- Mark as New
- Bookmark
- Subscribe
- Mute
- Subscribe to RSS Feed
- Permalink
- Report Inappropriate Content
Total line type in line chart
Colleagues, good day!
I have one pivot table, which also include Total line by activating Total in Dimension Limits Tab.
Tell me please, how i can change type of this total? (for example, dotted line)
Thanks.
Accepted Solutions
- Mark as New
- Bookmark
- Subscribe
- Mute
- Subscribe to RSS Feed
- Permalink
- Report Inappropriate Content
Click the + to the left of your expression and set the Line Style as per the Qv Desktop Help pasted below :
Line Style
Click on Line Style in order to enter an attribute expression for calculating the line style for the line or line segment associated with the data point. This type of attribute expression only has effect on line, combo and radar charts.
The relative width of the line can be controlled by including a tag <Wn> where n is a multiplying factor to be applied on the default line width of the chart. The number n must be a real number between 0.5 and 8. Example: <W2.5>. The style of the line can be controlled by including a tag <Sn> where n is an integer between 1 and 4 indicating the style to be used (1=continuous, 2= dashed, 3=dotted, 4=dashed/dotted). Example: <S3>. The <Wn> and <Sn> tags can be freely combined, but only the first occurrence of each counts. The tags must be enclosed by single quotations.
- Mark as New
- Bookmark
- Subscribe
- Mute
- Subscribe to RSS Feed
- Permalink
- Report Inappropriate Content
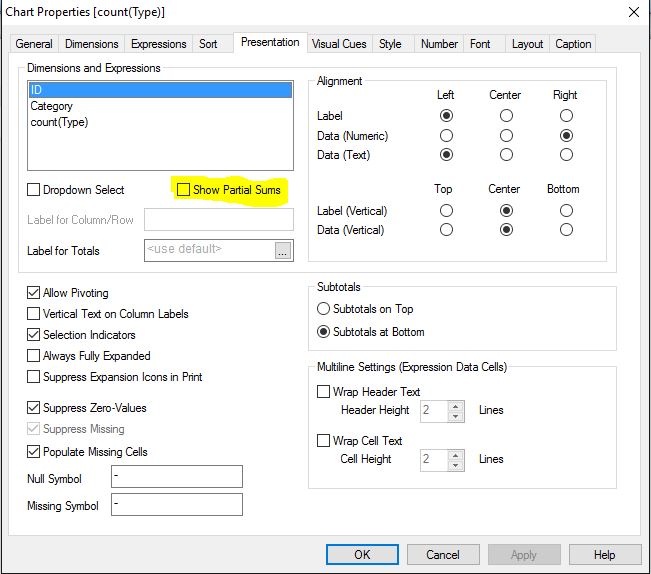
To show totals and sub-totals in a pivot table you should tick the Show Partial Sums option on the presentation tab.
- Mark as New
- Bookmark
- Subscribe
- Mute
- Subscribe to RSS Feed
- Permalink
- Report Inappropriate Content
There was some confusion as your question text mentions totals on a pivot chart but your title refers to a line chart!
Bill's response is correct for changing the format of a line on a line chart.
- Mark as New
- Bookmark
- Subscribe
- Mute
- Subscribe to RSS Feed
- Permalink
- Report Inappropriate Content
Thanks!
Bill, but this tags change line parameters for each values of dimension, but i need to apply it only for TOTAL line (which is shown by option Total on tab Dimensions Limits)