Unlock a world of possibilities! Login now and discover the exclusive benefits awaiting you.
- Qlik Community
- :
- All Forums
- :
- QlikView App Dev
- :
- Re: Values on data point
- Subscribe to RSS Feed
- Mark Topic as New
- Mark Topic as Read
- Float this Topic for Current User
- Bookmark
- Subscribe
- Mute
- Printer Friendly Page
- Mark as New
- Bookmark
- Subscribe
- Mute
- Subscribe to RSS Feed
- Permalink
- Report Inappropriate Content
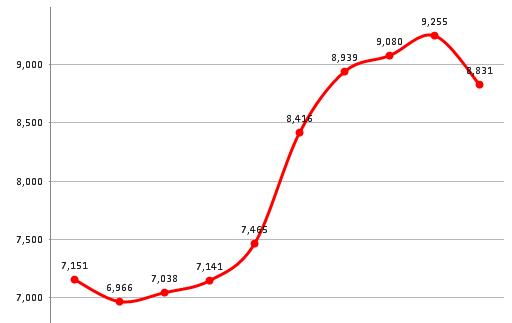
Values on data point
Hi,
I have a line graph like below. I need to show the data point values only at the start of line, mid of line and at the end of line. Can anyone help please.
Regards,
Santhosh
- Mark as New
- Bookmark
- Subscribe
- Mute
- Subscribe to RSS Feed
- Permalink
- Report Inappropriate Content
I dont think so it is possible.
The possible solution may be if u have something like : show data point for range 7000-7500 then 8000-8500 and so on... but still that need to test
- Mark as New
- Bookmark
- Subscribe
- Mute
- Subscribe to RSS Feed
- Permalink
- Report Inappropriate Content
Hi Santosh,
Please find attached file for solution.
Regards,
Jagan.
- Mark as New
- Bookmark
- Subscribe
- Mute
- Subscribe to RSS Feed
- Permalink
- Report Inappropriate Content
Great!!
i didnt know that.
- Mark as New
- Bookmark
- Subscribe
- Mute
- Subscribe to RSS Feed
- Permalink
- Report Inappropriate Content
Thanks for you reply Jagan.
I have dynamic values (week dates) in the dimension. Dimension values will change every month. Ex: for the current month I get week dates 4, 11, 18 and 25 as these days falls on Mondays, but same dates will not remain for next month Mondays.
In the given graph, I have used weekdate for a quarter. I need to show values for 1st week date of the 1st month, 1st week date of 2nd month and value for the latest week date of third month.
Regards,
Santhosh
- Mark as New
- Bookmark
- Subscribe
- Mute
- Subscribe to RSS Feed
- Permalink
- Report Inappropriate Content
Hi Santosh,
In place of hardcoded values, calculate start and end values by using Min and Max() and replace them in the expression. In the same calculate Mid values.
Hope this helps you.
Regards,
Jagan.