Unlock a world of possibilities! Login now and discover the exclusive benefits awaiting you.
- Qlik Community
- :
- All Forums
- :
- QlikView App Dev
- :
- Re: Visual Cues based on % Change
- Subscribe to RSS Feed
- Mark Topic as New
- Mark Topic as Read
- Float this Topic for Current User
- Bookmark
- Subscribe
- Mute
- Printer Friendly Page
- Mark as New
- Bookmark
- Subscribe
- Mute
- Subscribe to RSS Feed
- Permalink
- Report Inappropriate Content
Visual Cues based on % Change
Hi,
I am using QlikView 11, and need to change the colour of a cell based on the improvement/decline of a customers sales month on month. I've created my chart with Jan, Feb, Mar and Apr
For example, Jan was £1,548, Feb was £747, Mar was £1,160 and Apr was £1,325. The targets set are that Feb needs to be 10% more than Jan, Mar needs to be 10% more than Feb and Apr needs to be 10% more than Mar. If it isn't, go red, if it is go green.
Any help is appreciated.
Regards
David
- Mark as New
- Bookmark
- Subscribe
- Mute
- Subscribe to RSS Feed
- Permalink
- Report Inappropriate Content
Hi,
LOAD * INLINE [
Month, Amt
Jan, 1548
Feb, 747
Mar, 1160
Apr, 1325
];
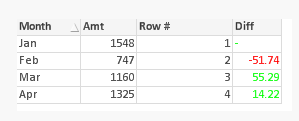
Row # Column
=RowNo(TOTAL)
Diff Column
=If(RowNo(TOTAL) > 1, If(Above(TOTAL Amt,1) > 0, Num((Amt-Above(TOTAL Amt,1))*100/Above(TOTAL Amt,1), '#.##')))
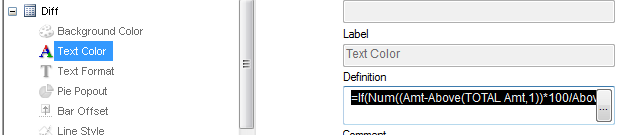
=If(Num((Amt-Above(TOTAL Amt,1))*100/Above(TOTAL Amt,1), '#.##') < 10, RGB(255,0,0), RGB(0,255,0))
- Mark as New
- Bookmark
- Subscribe
- Mute
- Subscribe to RSS Feed
- Permalink
- Report Inappropriate Content
Hi,
I'm calculating the totals using expressions, like this..
Sum (if (InMonth (Date, Today(), -3), [Sales Revenue])) then -2, -1 etc. to give me the sales for the previous months.
Where would I put the coding for this?
Regards
David
- Mark as New
- Bookmark
- Subscribe
- Mute
- Subscribe to RSS Feed
- Permalink
- Report Inappropriate Content
Hi David,
It will be difficult to provide any guidance without having your sample QVW file and complete understanding of data model. Share the file if you can.
I think you can utilize some sort of set analysis to achieve it.
Regards,
Vijay