Unlock a world of possibilities! Login now and discover the exclusive benefits awaiting you.
- Qlik Community
- :
- All Forums
- :
- QlikView App Dev
- :
- Waterfall Chart - Mix Grouped and Stacked Bars
- Subscribe to RSS Feed
- Mark Topic as New
- Mark Topic as Read
- Float this Topic for Current User
- Bookmark
- Subscribe
- Mute
- Printer Friendly Page
- Mark as New
- Bookmark
- Subscribe
- Mute
- Subscribe to RSS Feed
- Permalink
- Report Inappropriate Content
Waterfall Chart - Mix Grouped and Stacked Bars
Hello all,
I need to create a waterfall chart looking similar to something like this:
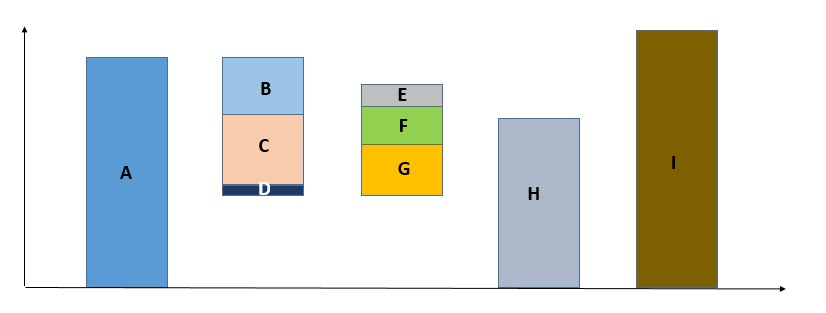
I am having difficulties creating this chart as it seems to be that mixing grouped and stacked bars in the same chart might not be possible.
If I have an expression, and I want to split my expression by the dimension in a stacked bar, the dimension will apply to all my 5 bars in the graph when I only want to apply it to the 2nd and 3rd bar.
Do you have any suggestion on how I should proceed ? I hope I was clear enough.
Thank you !
M.
- Mark as New
- Bookmark
- Subscribe
- Mute
- Subscribe to RSS Feed
- Permalink
- Report Inappropriate Content
See if this link helps (Images are not working, but I think you can download the attached qvws to see if one of those help)
- Mark as New
- Bookmark
- Subscribe
- Mute
- Subscribe to RSS Feed
- Permalink
- Report Inappropriate Content
Hi M V, I did something similar, the number of bars was fixed so I overlapped many different charts, one for the layout and one more for each bar.
Only the chart on the lower layer paints the axis, legends, etc... all the other charts has to have the same axis ranges (you'll need an expression that retrieves the max and min value from all charts -using rangeMax() and RangeMin() can help) and everything set as transparent, the only thing every chart paints is the bar.
Then you'll have to manually move each chart so the bar corresponds with the axis of the "layout chart".
If the number of bars isn't fixed (to 5 in your case) this solution can't work.