Unlock a world of possibilities! Login now and discover the exclusive benefits awaiting you.
- Qlik Community
- :
- All Forums
- :
- QlikView App Dev
- :
- Re: Waterfall chart bar graph order problem
- Subscribe to RSS Feed
- Mark Topic as New
- Mark Topic as Read
- Float this Topic for Current User
- Bookmark
- Subscribe
- Mute
- Printer Friendly Page
- Mark as New
- Bookmark
- Subscribe
- Mute
- Subscribe to RSS Feed
- Permalink
- Report Inappropriate Content
Waterfall chart bar graph order problem
HI Dear Community
I have a Waterfall Bar Graph With this expression (QV 10SR4 x64)
Sum ({<Año_Ventas={$(=Max(Año_Ventas))}>} [Valor de venta])/1000000
- Sum ({<Año_Ventas={$(=Max(Año_Ventas)-1)}>} [Valor de venta])/1000000
And This dimention
Linea de Venta
In the Offset Bar Expression i have this expression
If([Orden de Linea de Venta]=9,0,
rangesum (above((Sum ({<Año_Ventas={$(=Max(Año_Ventas))}>} [Valor de venta])/1000000
-Sum ({<Año_Ventas={$(=Max(Año_Ventas)-1)}>} [Valor de venta])/1000000),1,rowno()-1)))
The Field [Orden de Linea de Venta]=9 indicates the Total of expression per Linea de Venta Dimention values
| Orden de Linea de Venta | Linea de Venta |
| 1 | Osteosintesis General |
| 2 | Columna |
| 3 | CMF |
| 4 | Mano y Miembro Superior |
| 5 | Biomateriales |
| 6 | Motores y Accesorios |
| 7 | Productos Especiales |
| 9 | Total Linea de Venta |
The order of Dimention is Y Value Ascending
This is the result of Graph
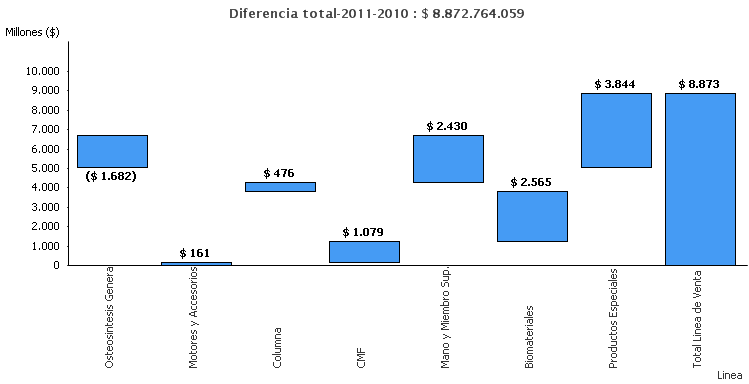
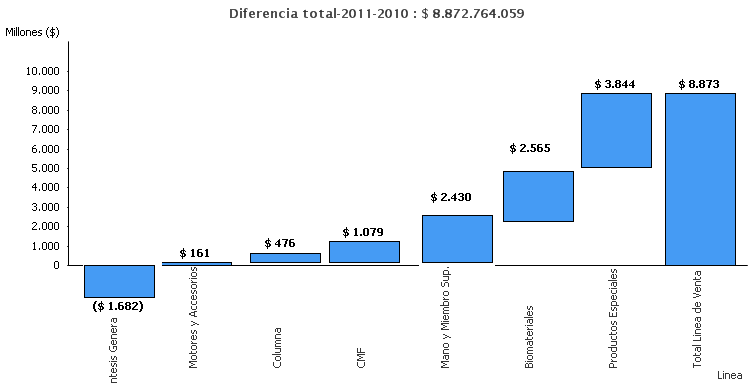
I need the graph in order to Size of columns Like to the next graph
Thanks for the Help
Accepted Solutions
- Mark as New
- Bookmark
- Subscribe
- Mute
- Subscribe to RSS Feed
- Permalink
- Report Inappropriate Content
Hi Marcos,
The way that you have it sorted is logically correct for the waterfall. The second bar should start below the line because it is a positive that is counter-acting the negative of the first bar. It is in the correct position.
I would be asking what, exactly, are you trying to achieve with the visualisation? Just an ordered bar chart might do the trick?
Regards,
Stephen
- Mark as New
- Bookmark
- Subscribe
- Mute
- Subscribe to RSS Feed
- Permalink
- Report Inappropriate Content
go to sort tab in chart properties and
uncheck all check box
and
select dimension fieldd and check Y value ascending
hope this helps
- Mark as New
- Bookmark
- Subscribe
- Mute
- Subscribe to RSS Feed
- Permalink
- Report Inappropriate Content
Hi Marcos,
If I have to do a Waterfall chart, I generally just do the bars as separate expressions - much easier to deal with.
Regards,
Stephen
- Mark as New
- Bookmark
- Subscribe
- Mute
- Subscribe to RSS Feed
- Permalink
- Report Inappropriate Content
Dear Community
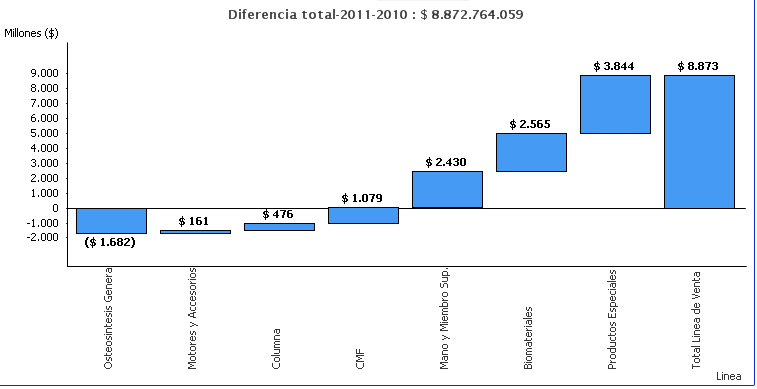
I changed the order per Expression Ascending (The same formula of expression)
Sum ({<Año_Ventas={$(=Max(Año_Ventas))}>} [Valor de venta])/1000000 - Sum ({<Año_Ventas={$(=Max(Año_Ventas)-1)}>} [Valor de venta])/1000000
And i obtain this graph is close to my objetive but i need the exactly objetive
- Mark as New
- Bookmark
- Subscribe
- Mute
- Subscribe to RSS Feed
- Permalink
- Report Inappropriate Content
Thanks for the answer Stephen Redmond ,
Yes i normally y use this option but with this Option How can i order the bars depends of Value?
- Mark as New
- Bookmark
- Subscribe
- Mute
- Subscribe to RSS Feed
- Permalink
- Report Inappropriate Content
Hi Marcos,
The way that you have it sorted is logically correct for the waterfall. The second bar should start below the line because it is a positive that is counter-acting the negative of the first bar. It is in the correct position.
I would be asking what, exactly, are you trying to achieve with the visualisation? Just an ordered bar chart might do the trick?
Regards,
Stephen
- Mark as New
- Bookmark
- Subscribe
- Mute
- Subscribe to RSS Feed
- Permalink
- Report Inappropriate Content
HI Stephen
I analyzed the results of the graph and the way the bars are presenting is correct, due to the negative value, the end user might be confused to see the positive value below the zero axis, I will explain as to why this happens and I understand
Thank you very much for your kind help.