Unlock a world of possibilities! Login now and discover the exclusive benefits awaiting you.
- Qlik Community
- :
- All Forums
- :
- QlikView App Dev
- :
- Re: Week start date to show bars for each day fall...
- Subscribe to RSS Feed
- Mark Topic as New
- Mark Topic as Read
- Float this Topic for Current User
- Bookmark
- Subscribe
- Mute
- Printer Friendly Page
- Mark as New
- Bookmark
- Subscribe
- Mute
- Subscribe to RSS Feed
- Permalink
- Report Inappropriate Content
Week start date to show bars for each day falling under the week
Hi Folks,
I see difficulty in representing week's day level data on a week starting date (i.e. Monday) with all the bars corresponding to each day of the week.
For example, I represent combo chart with above details. Now, I will need to show day level data with a dimension of week start date.
I have tried option WeekStart(Calendar_date). But it accumulates entire week and shows as single bar.
I need to show individual bars of each day and the week's starting date should represent all the bars of the days that fall under the week.
Could you please help me with this.
Thanks in advance,
VLC.
- Mark as New
- Bookmark
- Subscribe
- Mute
- Subscribe to RSS Feed
- Permalink
- Report Inappropriate Content
Hello Laxmaiah,
Trust that you are doing well!
As a workaround you can create two different dimensions as given below:
//Day Level Date value field
DateKey AS OrderDateKey,
//Week Start Date for given day
WeekStart(FullDateAlternateKey) AS WeekStartDay,
Post this reload the data and add these dimensions in Used Dimensions- WeekStartDay & OrderDateKey respectively (WeekStartDay with highest priority) and add the required expressions.
This will give you expected result.
Regards!
Rahul
- Mark as New
- Bookmark
- Subscribe
- Mute
- Subscribe to RSS Feed
- Permalink
- Report Inappropriate Content
Hi,
Can you please share us some sample data with your application.?
Regards,
Suresh Sindhigi
- Mark as New
- Bookmark
- Subscribe
- Mute
- Subscribe to RSS Feed
- Permalink
- Report Inappropriate Content
Hi Rahul,
Thank you for the help.
But this is not working.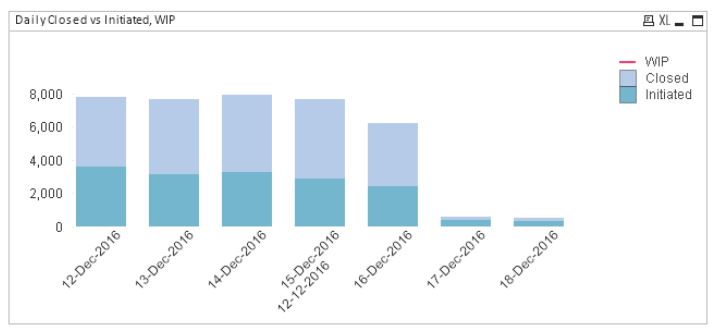
I see the above chart if I take WeekStart(Calender_Day) as primary dimension and Calendar_Day as secondary dimension in the used dimensions.
But I need to show individual bars of each day and the week's starting date should represent all the bars of the days that fall under the week.
Thanks,
VLC.
- Mark as New
- Bookmark
- Subscribe
- Mute
- Subscribe to RSS Feed
- Permalink
- Report Inappropriate Content
Hi Suresh,
Thanks for your help.
My data is like this.
Date Open Closure WIP
01-Dec-2016 5000 5200 1800
02-Dec-2016 5100 5400 4520
03-Dec-2016 5040 4800 6790
04-Dec-2016 6200 6800 3870
05-Dec-2016 5280 9800 3405
06-Dec-2016 5346 6700 8045
07-Dec-2016 8790 8760 6708
08-Dec-2016 9870 9085 3450
09-Dec-2016 3076 5200 2486
and so on.
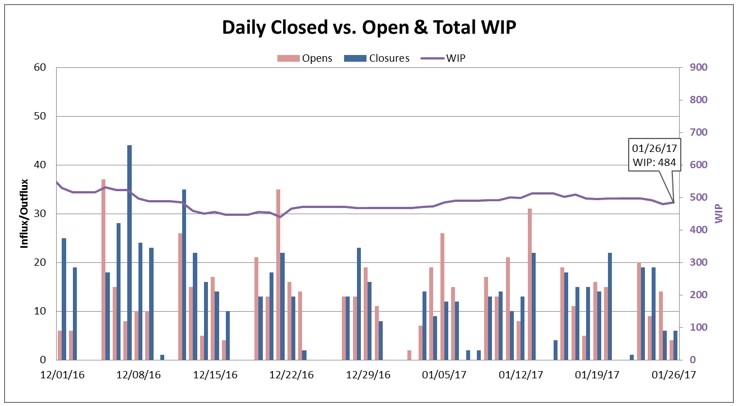
I show Combo chart with Open and Closure on bars; WIP on trendline.
But I will need to represent week's day level data on a week starting date with all the bars corresponding to each day of the week. So my X-axis dimension should show only dates such 01-Dec-2016, 08-Dec-2016, 15-Dec-2016 etc with individual bars of each day that falls under the week.
Thanks,
VLC
- Mark as New
- Bookmark
- Subscribe
- Mute
- Subscribe to RSS Feed
- Permalink
- Report Inappropriate Content
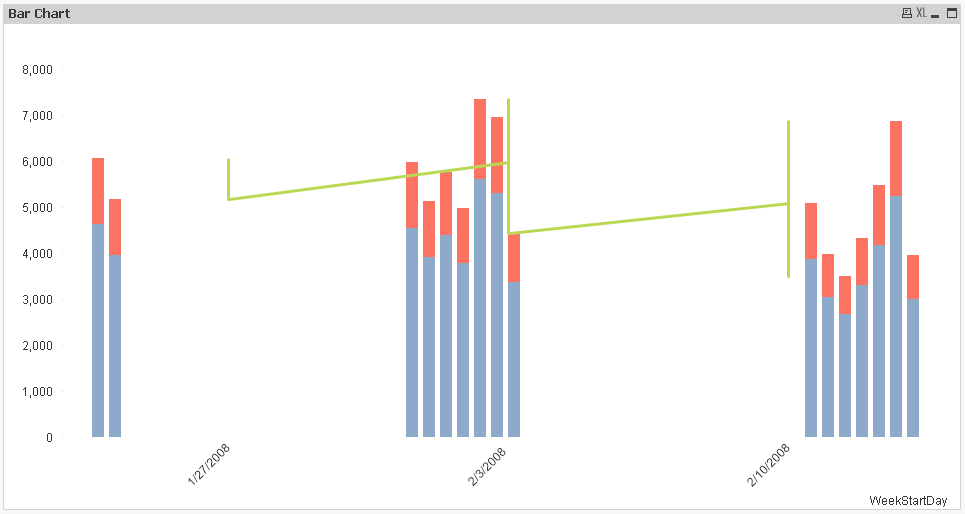
Hello Laxmaiah,
You can Calendar_Day (secondary dimension) you can suppress the Legend values (refer attached application).
Please share the application with sample data, if problem still persists.
Regards!
Rahul
- Mark as New
- Bookmark
- Subscribe
- Mute
- Subscribe to RSS Feed
- Permalink
- Report Inappropriate Content
Thanks Rahul Pawar.
It looks really good.
But I need to represent Open and Closure on two individual bars instead of one above the other.
I have tried updating salesDemo application to have it. But I do not see the feasibility.
Could you please help me with that.
Thanks,
VLC.