Unlock a world of possibilities! Login now and discover the exclusive benefits awaiting you.
- Qlik Community
- :
- All Forums
- :
- QlikView App Dev
- :
- What is wrong with my line chart?
- Subscribe to RSS Feed
- Mark Topic as New
- Mark Topic as Read
- Float this Topic for Current User
- Bookmark
- Subscribe
- Mute
- Printer Friendly Page
- Mark as New
- Bookmark
- Subscribe
- Mute
- Subscribe to RSS Feed
- Permalink
- Report Inappropriate Content
What is wrong with my line chart?
I tried to create 3 different line charts for 2018, 2019 and 2020 respectively. I have a column, [invoiced_mo], that is formatted like so: YYYY_MM. I want it to be 'MMM-YY' so I created a new field called [MONTH_YEAR] in my script to do so, which did work.
LOAD Date(MonthName(Date#([invoiced_mo], 'YYYY_MM')), 'MMM-YY') as MONTH_YEAR
FROM $(vQVDPathExtract)Vendor_Billing.qvd (qvd);
Because [MONTH_YEAR] includes all 3 years, I then separated by the corresponding year as a calculated dimension in each line chart:
=if(subfield(MONTH_YEAR,'-',2)='18',MONTH_YEAR)
=if(subfield(MONTH_YEAR,'-',2)='19',MONTH_YEAR)
=if(subfield(MONTH_YEAR,'-',2)='20',MONTH_YEAR)
Then for each of the line charts, I did 2 simple expressions to sum the total costs and total number of requests (e.g. sum(price), count(requests)
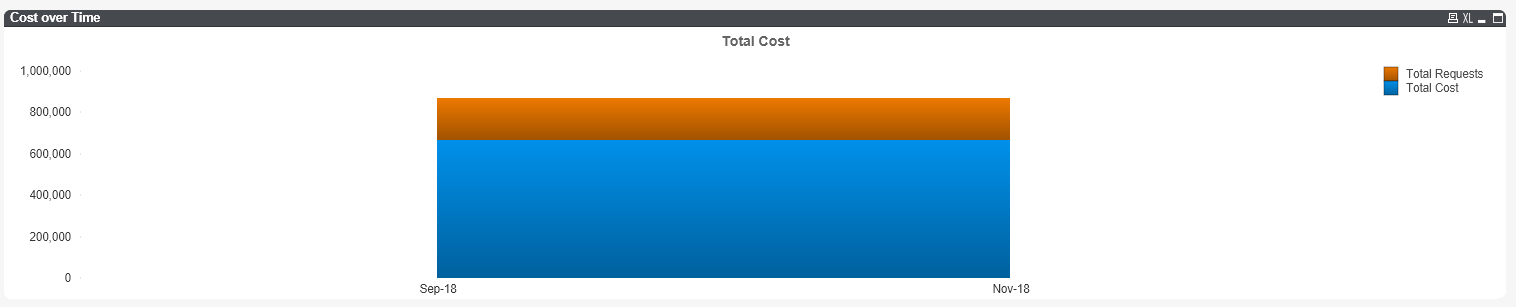
However, my line charts are showing a straight line across for the price and requests for each year. I'm not sure why the total costs/number of requests are not properly corresponding to the month/year data.
- Mark as New
- Bookmark
- Subscribe
- Mute
- Subscribe to RSS Feed
- Permalink
- Report Inappropriate Content
You may need to provide more info or a QVW at best. just looking at the pics, a lot of info is missed.
having said that, normally you would limit the YEAR in the expression and not in the dimension. You should link your fact to a calendar and in the calendar, you determine the year, month, etc..
then in your chart (if you really need a chart just for a specific year), you would have an expression
SUM({<YEAR={2020}>}Measure)
Your dimension could be MONTH (whatever format)
- Mark as New
- Bookmark
- Subscribe
- Mute
- Subscribe to RSS Feed
- Permalink
- Report Inappropriate Content
Thank you for your response! I'm relatively new to qlik (been using it for a little over a month) so I apologize for the silly question I'm about to ask, but could you please explain what all the additional characters mean or do in your expression, SUM({<YEAR={2020}>}Measure)? I created the master calendar per your suggestion and put the month as a dimension. I'm just not understanding how to properly execute the expression line. Thanks!
- Mark as New
- Bookmark
- Subscribe
- Mute
- Subscribe to RSS Feed
- Permalink
- Report Inappropriate Content
That is Set Analysis, here is a Design Blog post that should be useful as well as Help Doc Link:
https://community.qlik.com/t5/Qlik-Design-Blog/A-Primer-on-Set-Analysis/ba-p/1468344
If you wish to search more in the Design Blog area, use this link:
https://community.qlik.com/t5/Qlik-Design-Blog/bg-p/qlik-design-blog
Regards,
Brett
I now work a compressed schedule, Tuesday, Wednesday and Thursday, so those will be the days I will reply to any follow-up posts.