Unlock a world of possibilities! Login now and discover the exclusive benefits awaiting you.
- Qlik Community
- :
- All Forums
- :
- QlikView App Dev
- :
- Y Axis at 0 X
- Subscribe to RSS Feed
- Mark Topic as New
- Mark Topic as Read
- Float this Topic for Current User
- Bookmark
- Subscribe
- Mute
- Printer Friendly Page
- Mark as New
- Bookmark
- Subscribe
- Mute
- Subscribe to RSS Feed
- Permalink
- Report Inappropriate Content
Y Axis at 0 X
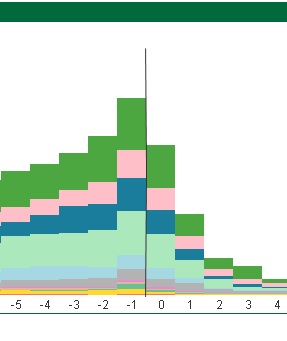
I have a bar chart with X values from -33 to +8. I would like to show the line that represents the Y axis at the zero point on the X axis. Is there a way to force a vertical line at X=0 on a bar chart? Attached is a sample of what I'd like to see.
Failing that, can I force the X axis to always go from the minimum to the maximum when I filter the data? I could then draw a vertical line and move the chart to the bottom so the vertical line will always show, but it would not change dynamically if the X values increase on either end. So the first option (display Y axis at 0 on X) is preferred.
Accepted Solutions
- Mark as New
- Bookmark
- Subscribe
- Mute
- Subscribe to RSS Feed
- Permalink
- Report Inappropriate Content
You can add a reference line when switching the dimension axis to "continuous".
hope this helps
regards
Marco
- Mark as New
- Bookmark
- Subscribe
- Mute
- Subscribe to RSS Feed
- Permalink
- Report Inappropriate Content
You can add a reference line when switching the dimension axis to "continuous".
hope this helps
regards
Marco
- Mark as New
- Bookmark
- Subscribe
- Mute
- Subscribe to RSS Feed
- Permalink
- Report Inappropriate Content
Chart properties -> Axes -> Mark 'Continuous' checked for Dimension Axis.
- Mark as New
- Bookmark
- Subscribe
- Mute
- Subscribe to RSS Feed
- Permalink
- Report Inappropriate Content
How does one add a reference line?