Unlock a world of possibilities! Login now and discover the exclusive benefits awaiting you.
- Qlik Community
- :
- All Forums
- :
- QlikView App Dev
- :
- combined graph
- Subscribe to RSS Feed
- Mark Topic as New
- Mark Topic as Read
- Float this Topic for Current User
- Bookmark
- Subscribe
- Mute
- Printer Friendly Page
- Mark as New
- Bookmark
- Subscribe
- Mute
- Subscribe to RSS Feed
- Permalink
- Report Inappropriate Content
combined graph
Goodmorning everyone
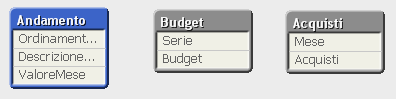
attached an example of a dashboard that would like to achieve
for convenience I imported the database directly in the script via the load inline.
the obbettivo is to represent a combined graph with the trend with the ratio of the budget and purchases.
the budget year is distributed under the budget for the current month (in this case (11/2015) divided the month to month value.
purchases must instead be represented by retrieving data from the purchases table but is valued only for a few months
what I want to achieve is a similar result to the one shown in the figure, with both representations
Thanks to all for your cooperation
Andrea
- « Previous Replies
-
- 1
- 2
- Next Replies »
- Mark as New
- Bookmark
- Subscribe
- Mute
- Subscribe to RSS Feed
- Permalink
- Report Inappropriate Content
Without changes to script solution:
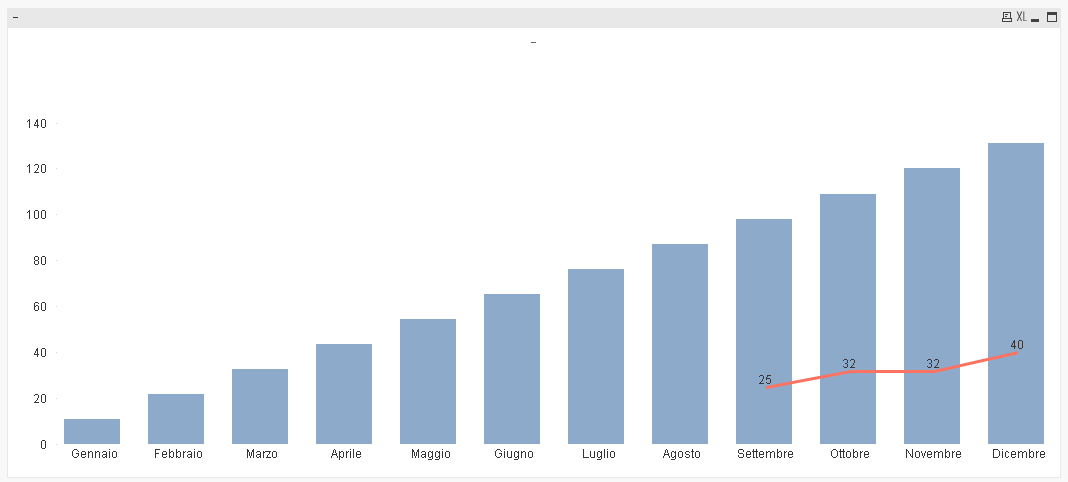
Expression for red line:
=Aggr(If(OrdinamentoMese = Mese, Sum(Acquisti)), OrdinamentoMese, Mese)
- Mark as New
- Bookmark
- Subscribe
- Mute
- Subscribe to RSS Feed
- Permalink
- Report Inappropriate Content
I would say that the result is correct.
just one more thing I'm sorry
I sent you an example handwritten
actually in the database field the month is called the month for both purchases and sales.
I tried to modify the expression, but when I select a time I go to see the budget data but only the point on the sale today, but if not I select the period shows me only four months of sales, but not the budget
Could you ottonere the result that you sent me first with this database?
keep in mind that the month must always be selected and to defaul is the last.
Thank you
Andrea
- Mark as New
- Bookmark
- Subscribe
- Mute
- Subscribe to RSS Feed
- Permalink
- Report Inappropriate Content
Check out the attached:
- « Previous Replies
-
- 1
- 2
- Next Replies »