Unlock a world of possibilities! Login now and discover the exclusive benefits awaiting you.
- Qlik Community
- :
- All Forums
- :
- QlikView App Dev
- :
- Re: customized grouping in pivot-tables
- Subscribe to RSS Feed
- Mark Topic as New
- Mark Topic as Read
- Float this Topic for Current User
- Bookmark
- Subscribe
- Mute
- Printer Friendly Page
- Mark as New
- Bookmark
- Subscribe
- Mute
- Subscribe to RSS Feed
- Permalink
- Report Inappropriate Content
customized grouping in pivot-tables
Hi everybody,
I am currently working with QV and need to migrate former reports from excel. A common issue that has not been solved yet is the implementation of 'customized' subtotals in pivot tables.
For example: For certain clusters or product segments we'd like to show subtotals in our pivot table (see attachment). Is there an…Weitere anzeigenFor example: For certain clusters or product segments I'd like to show subtotals in our pivot table (see attachment). Is there any option to group dimensions individually within QV?
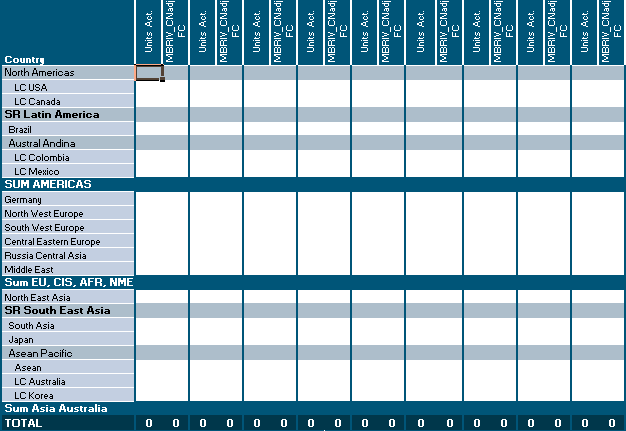
I am aware of the possibility to map the clusters/product segments beforehand and to add another level to the dimension. Then we could show the subtotals for this new dimension. However, I consider this option as not nice - especially in large pivot charts.
Any tips & tricks?
Any information would me much appreciated.
Best regards,
Tobias
Accepted Solutions
- Mark as New
- Bookmark
- Subscribe
- Mute
- Subscribe to RSS Feed
- Permalink
- Report Inappropriate Content
Hi Tobias,
if you need these within a single dimension, you could potentially add a side dimension grouping for your country field, adding in the required sub total values you require against the corresponding countries.
This would side separately to your main fact table and so your standard expressions should work fine for it.
you can then add some logic to the dimension and expression format to bold the rows you want.
Have a look at the attached, should give you the idea of what I mean
hope that helps
Joe
- Mark as New
- Bookmark
- Subscribe
- Mute
- Subscribe to RSS Feed
- Permalink
- Report Inappropriate Content
Hi Tobias,
this could be a long shot in the dark. try to tick the "Dropdown select" and "Show Partial Sums", under the "Presentations" sheet in your Chart properties. selected it for every expression.
Hope it helps.
- Mark as New
- Bookmark
- Subscribe
- Mute
- Subscribe to RSS Feed
- Permalink
- Report Inappropriate Content
If it should be in one single dimension you will need additionally dimension-items within your data-model:
concatenate (CountryDimensionTable)
Load * Inline [
Country
Sum America
Sum Asia
...
];
Maybe you used an extra Country field for this - Country as CountryWithPartialSumDummy - to keep your main field clean. Then within the expressions you need to query these Country field if it is a partial sum and when it is then use some set analysis statements like: if(Country = 'Sum ...', sum({< Country = {'x', 'y', 'z'}>} value), sum(value)).
But with an additionally Country group and native partial sums would it be easier and such Country group could be very small, maybe only a number or a single char.
- Marcus
- Mark as New
- Bookmark
- Subscribe
- Mute
- Subscribe to RSS Feed
- Permalink
- Report Inappropriate Content
Hi Tobias,
if you need these within a single dimension, you could potentially add a side dimension grouping for your country field, adding in the required sub total values you require against the corresponding countries.
This would side separately to your main fact table and so your standard expressions should work fine for it.
you can then add some logic to the dimension and expression format to bold the rows you want.
Have a look at the attached, should give you the idea of what I mean
hope that helps
Joe
- Mark as New
- Bookmark
- Subscribe
- Mute
- Subscribe to RSS Feed
- Permalink
- Report Inappropriate Content
Hi Marcus,
Even though Joe's input already helps me out, I'd like to understand your proposal. How can I add this extra country field and query this field?
BR Tobias
- Mark as New
- Bookmark
- Subscribe
- Mute
- Subscribe to RSS Feed
- Permalink
- Report Inappropriate Content
I meant simply to add a few dummy-rows to your dimension (maybe per xls or inline-load) with the result that country had not only real values from a fact- or a dimension-table else dummy-values like "Sum XYZ". And within the chart you queries these rows with an expression like above mentioned.
But better is you used normal hierachical dimensions with partial sums instead a customized view.
- Marcus