Unlock a world of possibilities! Login now and discover the exclusive benefits awaiting you.
- Qlik Community
- :
- All Forums
- :
- QlikView App Dev
- :
- grouping date on x axis
- Subscribe to RSS Feed
- Mark Topic as New
- Mark Topic as Read
- Float this Topic for Current User
- Bookmark
- Subscribe
- Mute
- Printer Friendly Page
- Mark as New
- Bookmark
- Subscribe
- Mute
- Subscribe to RSS Feed
- Permalink
- Report Inappropriate Content
grouping date on x axis
Hi I have about 1000 data points, of dates and widgets sold. I want to make a graph with date on the axis, however i want it to show as a very long trend graph. I want to show from 2001 Jan to Dec then 2002 , jan to Dec then 2003 Jan to Dec. I am having a lot of trouble.
I have tried adding the dimension Year(saledate)&'/'Month(saledate) and sort by saledate - but still get very odd graph.
Jo
Accepted Solutions
- Mark as New
- Bookmark
- Subscribe
- Mute
- Subscribe to RSS Feed
- Permalink
- Report Inappropriate Content
Actually I think it is correct ... I just redid the chart
1. changed the chart (chose it from Right click the sheet )
2. expanded and saw that the correct sequence ...
Thank you
- Mark as New
- Bookmark
- Subscribe
- Mute
- Subscribe to RSS Feed
- Permalink
- Report Inappropriate Content
Hi,
Try adding dimension using monthname function
MonthName(saledate) as monthyear
HTH
Sushil
- Mark as New
- Bookmark
- Subscribe
- Mute
- Subscribe to RSS Feed
- Permalink
- Report Inappropriate Content
- Mark as New
- Bookmark
- Subscribe
- Mute
- Subscribe to RSS Feed
- Permalink
- Report Inappropriate Content
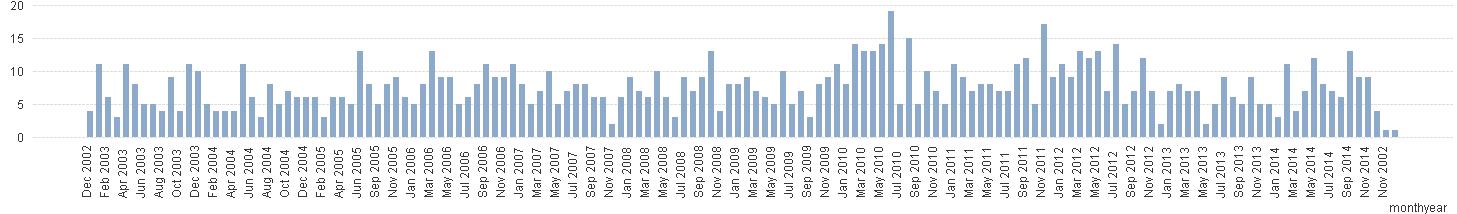
Sushil Kumar this is what I get: still cannot sort i don't know if you can see it but the 1st and last valure are Nov 2002 and Dec 2002 - the rest seems ok!
- Mark as New
- Bookmark
- Subscribe
- Mute
- Subscribe to RSS Feed
- Permalink
- Report Inappropriate Content
Actually I think it is correct ... I just redid the chart
1. changed the chart (chose it from Right click the sheet )
2. expanded and saw that the correct sequence ...
Thank you