Unlock a world of possibilities! Login now and discover the exclusive benefits awaiting you.
- Qlik Community
- :
- All Forums
- :
- QlikView App Dev
- :
- Re: help on ColorMix1 function
- Subscribe to RSS Feed
- Mark Topic as New
- Mark Topic as Read
- Float this Topic for Current User
- Bookmark
- Subscribe
- Mute
- Printer Friendly Page
- Mark as New
- Bookmark
- Subscribe
- Mute
- Subscribe to RSS Feed
- Permalink
- Report Inappropriate Content
help on ColorMix1 function
Hi All,
In my dashboard to maintain same color combination i have used ColorMix1 function as a background expression on almost all the charts. The results are as per expectations but when selecting a single selection on any chart the color is turning to Black.
1. I am using Red and Green as my primary colors and this is working fine when there are two customer countries.
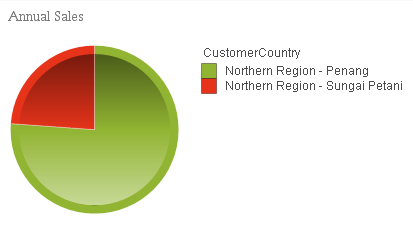
2. When i click on 'Northern Region - Penang' Customer country the color on pie chart becoming Black and on legend it is blue. But i want it to be either green or red based on the sales amount.
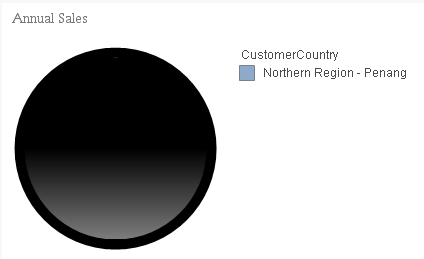
Formula i used on my expression tab is 'Sum(Sales)'
and background expression is
'ColorMix1 ((1+Sign(2*(sum(Sales)-RangeMin (top(total sum(Sales),1,NoOfRows(total))))/(RangeMax (top(total sum(Sales),1,NoOfRows(total)))-RangeMin (top(total sum(Sales),1,NoOfRows(total))))-1)*Sqrt(Fabs((2*(sum(Sales)-RangeMin (top(total sum(Sales),1,NoOfRows(total))))/(RangeMax (top(total sum(Sales),1,NoOfRows(total)))-RangeMin (top(total sum(Sales),1,NoOfRows(total))))-1))))/2, cBad,cGood)'
cBad value is =rgb(230,51,26)
CGood value is =rgb(145,180,50)
Please suggest me to resolve this issue. Any help will be more appreciated.
Regards,
Harika
Accepted Solutions
- Mark as New
- Bookmark
- Subscribe
- Mute
- Subscribe to RSS Feed
- Permalink
- Report Inappropriate Content
Thank you for the explanation Gysbert, Now i understand why it is getting failed.
I have added an If condition to avoid black color and I have given a blue color which is more meaningful as the color between Legend and graph matched perfectly.
if(isnull(ColorMix1 ((1+Sign(2*(sum(Sales)-RangeMin (top(total sum(Sales),1,NoOfRows(total))))/(RangeMax (top(total sum(Sales),1,NoOfRows(total)))-RangeMin (top(total sum(Sales),1,NoOfRows(total))))-1)*Sqrt(Fabs((2*(sum(Sales)-RangeMin (top(total sum(Sales),1,NoOfRows(total))))/(RangeMax (top(total sum(Sales),1,NoOfRows(total)))-RangeMin (top(total sum(Sales),1,NoOfRows(total))))-1))))/2, cBad,cGood)),
RGB(141,170,203),
ColorMix1 ((1+Sign(2*(sum(Sales)-RangeMin (top(total sum(Sales),1,NoOfRows(total))))/(RangeMax (top(total sum(Sales),1,NoOfRows(total)))-RangeMin (top(total sum(Sales),1,NoOfRows(total))))-1)*Sqrt(Fabs((2*(sum(Sales)-RangeMin (top(total sum(Sales),1,NoOfRows(total))))/(RangeMax (top(total sum(Sales),1,NoOfRows(total)))-RangeMin (top(total sum(Sales),1,NoOfRows(total))))-1))))/2, cBad,cGood))
Regards,
Harika
- Mark as New
- Bookmark
- Subscribe
- Mute
- Subscribe to RSS Feed
- Permalink
- Report Inappropriate Content
Try this:
ColorMix1 ((1+Sign(2*(sum({<CustomerCountry=>}Sales)-RangeMin (top(total sum({<CustomerCountry=>}Sales),1,NoOfRows(total))))/(RangeMax (top(total sum({<CustomerCountry=>}Sales),1,NoOfRows(total)))-RangeMin (top(total sum({<CustomerCountry=>}Sales),1,NoOfRows(total))))-1)*Sqrt(Fabs((2*(sum({<CustomerCountry=>}Sales)-RangeMin (top(total sum({<CustomerCountry=>}Sales),1,NoOfRows(total))))/(RangeMax (top(total sum({<CustomerCountry=>}Sales),1,NoOfRows(total)))-RangeMin (top(total sum({<CustomerCountry=>}Sales),1,NoOfRows(total))))-1))))/2, cBad,cGood)
talk is cheap, supply exceeds demand
- Mark as New
- Bookmark
- Subscribe
- Mute
- Subscribe to RSS Feed
- Permalink
- Report Inappropriate Content
Hi Gysbert,
Thank you for your quick response. After i use your formula the chart stopped responding and even I am unable to go further to other customer countries.
To be more precise I am attaching sample qvw with both the pie charts on place.
When ever i try to select single Customer or Customer Country the color is black.
Regards,
Harika
- Mark as New
- Bookmark
- Subscribe
- Mute
- Subscribe to RSS Feed
- Permalink
- Report Inappropriate Content
You're using dimension limits to show only the first five and group the rest as Other. I don't have a solution to handle such a use case. Once you select one value the colormix function won't work anymore because there's only one value of sum(Sales) left to calculate with.
talk is cheap, supply exceeds demand
- Mark as New
- Bookmark
- Subscribe
- Mute
- Subscribe to RSS Feed
- Permalink
- Report Inappropriate Content
Thank you for the explanation Gysbert, Now i understand why it is getting failed.
I have added an If condition to avoid black color and I have given a blue color which is more meaningful as the color between Legend and graph matched perfectly.
if(isnull(ColorMix1 ((1+Sign(2*(sum(Sales)-RangeMin (top(total sum(Sales),1,NoOfRows(total))))/(RangeMax (top(total sum(Sales),1,NoOfRows(total)))-RangeMin (top(total sum(Sales),1,NoOfRows(total))))-1)*Sqrt(Fabs((2*(sum(Sales)-RangeMin (top(total sum(Sales),1,NoOfRows(total))))/(RangeMax (top(total sum(Sales),1,NoOfRows(total)))-RangeMin (top(total sum(Sales),1,NoOfRows(total))))-1))))/2, cBad,cGood)),
RGB(141,170,203),
ColorMix1 ((1+Sign(2*(sum(Sales)-RangeMin (top(total sum(Sales),1,NoOfRows(total))))/(RangeMax (top(total sum(Sales),1,NoOfRows(total)))-RangeMin (top(total sum(Sales),1,NoOfRows(total))))-1)*Sqrt(Fabs((2*(sum(Sales)-RangeMin (top(total sum(Sales),1,NoOfRows(total))))/(RangeMax (top(total sum(Sales),1,NoOfRows(total)))-RangeMin (top(total sum(Sales),1,NoOfRows(total))))-1))))/2, cBad,cGood))
Regards,
Harika