Unlock a world of possibilities! Login now and discover the exclusive benefits awaiting you.
- Qlik Community
- :
- All Forums
- :
- QlikView App Dev
- :
- hierarchy of task (Task Physical Percent Complete”...
- Subscribe to RSS Feed
- Mark Topic as New
- Mark Topic as Read
- Float this Topic for Current User
- Bookmark
- Subscribe
- Mute
- Printer Friendly Page
- Mark as New
- Bookmark
- Subscribe
- Mute
- Subscribe to RSS Feed
- Permalink
- Report Inappropriate Content
hierarchy of task (Task Physical Percent Complete”)
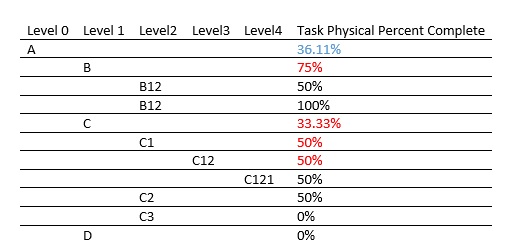
I have hierarchy of task with different level
and only for last level I have “Task Physical Percent Complete”
and each Task has unique ID and Unique Parent ID
I want to roll up the average of “Task Physical Percent Complete” and show it in chart in QlikView
For example:
- Mark as New
- Bookmark
- Subscribe
- Mute
- Subscribe to RSS Feed
- Permalink
- Report Inappropriate Content
This is not exactely what you were asking for, but I would suggest rethinking the way you calculate the averages.
If both level B1 and B2 (I think there is a typo in your sample, so renaming it) tasks have been completed to 50% resp. 100%, does the parent task B should really display 75%?
Let's assume B1 task shows 50% because 50 hours from 100 planned are done. And B2 shows 100% because 5 hours from 5 hours planned are done.
For the parent task B, 55 hours done of 105 hoursplanned results in 52% completion, not 75%.
I really think you should aggregate your hours done and divide by the sum of hours planned, this should give you the correct completion percentage on every level.
This would imply that you add both measures to your data model, of course.
Maybe have a look also into