Unlock a world of possibilities! Login now and discover the exclusive benefits awaiting you.
- Qlik Community
- :
- All Forums
- :
- QlikView App Dev
- :
- highlighting trends in line chart
- Subscribe to RSS Feed
- Mark Topic as New
- Mark Topic as Read
- Float this Topic for Current User
- Bookmark
- Subscribe
- Mute
- Printer Friendly Page
- Mark as New
- Bookmark
- Subscribe
- Mute
- Subscribe to RSS Feed
- Permalink
- Report Inappropriate Content
highlighting trends in line chart
Hi,
I have a line chart. with dimension as country for a given date.It shows me the count of records.
Is it possible to highlight portions of the graph with the steepest dips as shown in the attachment?
Regards,
Anju
Accepted Solutions
- Mark as New
- Bookmark
- Subscribe
- Mute
- Subscribe to RSS Feed
- Permalink
- Report Inappropriate Content
Try this way
if(sum(Value)=max(total aggr( sum(Value), DATE)),sum(Value),null()),
- Mark as New
- Bookmark
- Subscribe
- Mute
- Subscribe to RSS Feed
- Permalink
- Report Inappropriate Content
Well, in your 3MB pic, I see you have 2 local minimuns.
Change your graph to Lines and Bars.
You may create a new expression in a bar expression and show only a determinate point.
If(Value = max(Value), Value) or something like that.
You may have to aggregate this funcktion on the dimension or dimensions required.
To get the second max(Value), exclude from the expression the first max. It's that possible?
Good Luck.
- Mark as New
- Bookmark
- Subscribe
- Mute
- Subscribe to RSS Feed
- Permalink
- Report Inappropriate Content
Hi Christian,
Thanks for replying..
I used this expression
=if(TOTAL_COUNT=min({$}TOTAL_COUNT),dual('LOW',TOTAL_COUNT))
I want the text 'LOW' to appear over min value of TOTALCOUNT, but instead I get a continous red line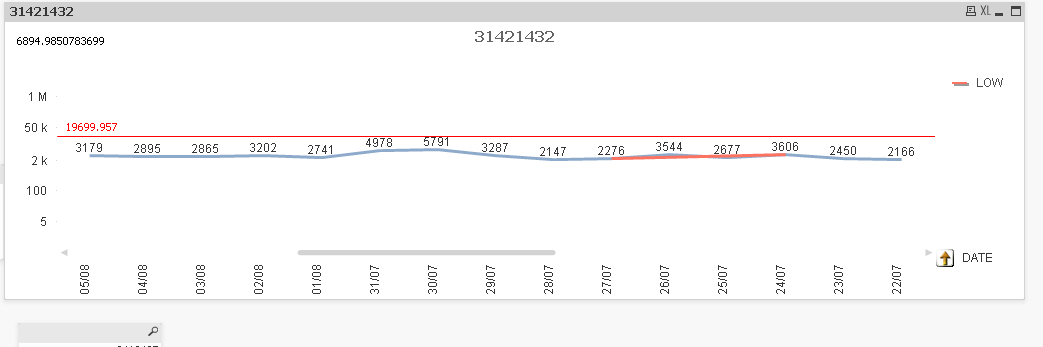
- Mark as New
- Bookmark
- Subscribe
- Mute
- Subscribe to RSS Feed
- Permalink
- Report Inappropriate Content
Go to Object Properties.
You'll see different graphics. Chose the one showing lines and bars. In the Expressions tab, select your 2nd expression and check bars, uncheck lines.
- Set your 2nd expression as If(sum(Value)=aggr(Max(sum(Value)),Date), sum(Value), null()) à Something like that
You’ll see a bar only in the correct date.
- Mark as New
- Bookmark
- Subscribe
- Mute
- Subscribe to RSS Feed
- Permalink
- Report Inappropriate Content
I gave this expression ..
=if((TOTAL_COUNT)=min({$}(TOTAL_COUNT)),(TOTAL_COUNT),null())
but I am getting bars in a number of places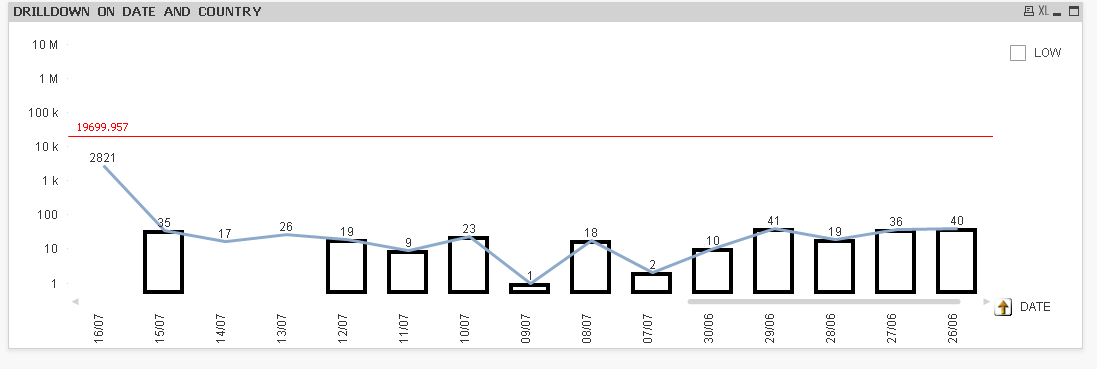
- Mark as New
- Bookmark
- Subscribe
- Mute
- Subscribe to RSS Feed
- Permalink
- Report Inappropriate Content
I get the same result when I give
=if((TOTAL_COUNT)=aggr(min(TOTAL_COUNT),LOCAL_TIME),(TOTAL_COUNT),null())
- Mark as New
- Bookmark
- Subscribe
- Mute
- Subscribe to RSS Feed
- Permalink
- Report Inappropriate Content
Try this way
if(sum(Value)=max(total aggr( sum(Value), DATE)),sum(Value),null()),
- Mark as New
- Bookmark
- Subscribe
- Mute
- Subscribe to RSS Feed
- Permalink
- Report Inappropriate Content
Its working .. Thank You!!
I was also able to show it country wise for drilldown in the same chart by adding the expression
=if(sum(TOTAL_COUNT)=min(total aggr( sum(TOTAL_COUNT), COUNTRY)),sum(TOTAL_COUNT),null())
I have a doubt, how does total affect the final result?
- Mark as New
- Bookmark
- Subscribe
- Mute
- Subscribe to RSS Feed
- Permalink
- Report Inappropriate Content
how do I mark an answer as the correct answer?