Unlock a world of possibilities! Login now and discover the exclusive benefits awaiting you.
- Qlik Community
- :
- All Forums
- :
- QlikView App Dev
- :
- Re: how to create multiple line charts each with o...
Options
- Subscribe to RSS Feed
- Mark Topic as New
- Mark Topic as Read
- Float this Topic for Current User
- Bookmark
- Subscribe
- Mute
- Printer Friendly Page
Turn on suggestions
Auto-suggest helps you quickly narrow down your search results by suggesting possible matches as you type.
Showing results for
Anonymous
Not applicable
2017-03-31
08:00 AM
- Mark as New
- Bookmark
- Subscribe
- Mute
- Subscribe to RSS Feed
- Permalink
- Report Inappropriate Content
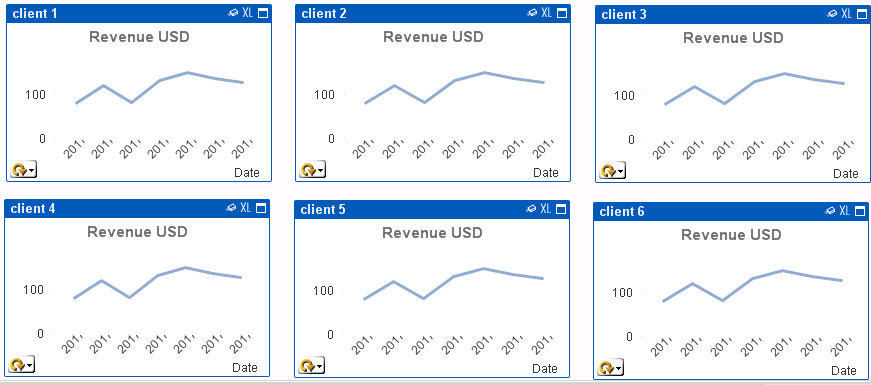
how to create multiple line charts each with one value of a dimension
Hi, all,
I have a requirement to create a group of line charts, and in each chart, one dimension has only one value. (For my case, "client 1", "client 2", and so on are from ClientName field). Example like below:
I remember I saw discussion about this kind of chart some time ago, but can not find it.
Any people can provide me a hint?
Thanks
376 Views
1 Solution
Accepted Solutions
MVP
2017-03-31
08:03 AM
- Mark as New
- Bookmark
- Subscribe
- Mute
- Subscribe to RSS Feed
- Permalink
- Report Inappropriate Content
Your taking about the trellis?
2 Replies
MVP
2017-03-31
08:03 AM
- Mark as New
- Bookmark
- Subscribe
- Mute
- Subscribe to RSS Feed
- Permalink
- Report Inappropriate Content
Your taking about the trellis?
Anonymous
Not applicable
2017-03-31
08:14 AM
Author
- Mark as New
- Bookmark
- Subscribe
- Mute
- Subscribe to RSS Feed
- Permalink
- Report Inappropriate Content
Hi, Avinash,
Thanks for your quick reply.
Zhihong
264 Views