Unlock a world of possibilities! Login now and discover the exclusive benefits awaiting you.
- Qlik Community
- :
- All Forums
- :
- QlikView App Dev
- :
- Re: how to minimize one chart and place another ch...
- Subscribe to RSS Feed
- Mark Topic as New
- Mark Topic as Read
- Float this Topic for Current User
- Bookmark
- Subscribe
- Mute
- Printer Friendly Page
- Mark as New
- Bookmark
- Subscribe
- Mute
- Subscribe to RSS Feed
- Permalink
- Report Inappropriate Content
how to minimize one chart and place another chart by one click
HI
I have two charts in my sheet , with the help of a button click, i need to place my 2nd chart in the place of 1st chart(1st chart should be minimized) and when i again click the Button my 1st chart has two come into the place of 2nd(now,2nd should be minimized).
How can i do this.
Please check the attachment for Better Understanding .
Thanks in Advance,
Dileep.
Accepted Solutions
- Mark as New
- Bookmark
- Subscribe
- Mute
- Subscribe to RSS Feed
- Permalink
- Report Inappropriate Content
You can use a variable to show/hide the charts by clicking a button. See attached qvw.
talk is cheap, supply exceeds demand
- Mark as New
- Bookmark
- Subscribe
- Mute
- Subscribe to RSS Feed
- Permalink
- Report Inappropriate Content
create a button object then on button right click properties
add action -> layout-> minimize object give Id of first object
similarly create another button object for secod object
add action -> layout-> minimize object
give Id of second obect.
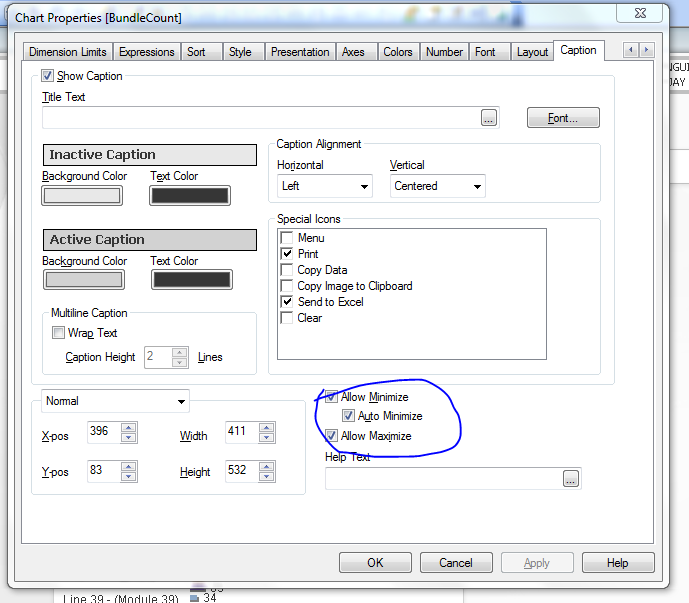
on each object go out to cation tab and check auto minimize
anant
- Mark as New
- Bookmark
- Subscribe
- Mute
- Subscribe to RSS Feed
- Permalink
- Report Inappropriate Content
You can use a variable to show/hide the charts by clicking a button. See attached qvw.
talk is cheap, supply exceeds demand
- Mark as New
- Bookmark
- Subscribe
- Mute
- Subscribe to RSS Feed
- Permalink
- Report Inappropriate Content
Hi Kumar,
Please check out this link below , its very informative
http://www.youtube.com/watch?v=PSRBtw7SYD8
http://www.quickintelligence.co.uk/qlikview-buttons/
And,
You might think that there is not much to say about buttons in QlikView. If so you are probably not thinking much beyond a shiny lozenge of a thing that invites you to Clear Current Selections. I’m here to convince you otherwise.
Don’t Waste Space
The first thing to say here is that a Clear Current Selections button is totally redundant. That button is built right into the QlikView UI in Desktop and both Access Point versions. The same is true of Back, Bookmarks and (unless you have hidden your tabs) Next and Previous Tab buttons. Save yourself some space for some more analysis and don’t waste space with these buttons.

In my opinion shiny lozenges take far more space up than they need to and are visually distracting. You should not use these unless you really have to (i.e. your client or user insists).
Many objects can be Buttons
Anything that supports Actions can be a button. The lowly Text Area serves this purpose admirably, and if you have to use a gauge in your app, at least make it useful by making it clickable. A text box with no borders or shading provides a clickable line of text – like the ones that have served web pages so well for many years now.
With the use of dynamic colours you can have traffic light dashboard components that can also be useful for triggering actions (such as a dive to detail). Simple shading behind your text can make a useful toggle switch in your app.
Using Actions For Hiding Sheets
Here are some examples of text boxes performing the actions of buttons. These examples place values into variables, which are then used to do something dynamic in the app.
In most of the QlikView apps I produce I have some tabs for system data that is hidden from most users. To implement this I set a variable in the load script:
let vShowDev = 0; |
On the front sheet there is then a text box that has dynamic text:
=if (vShowDev = 0, 'Show', 'Hide') & ' Development Tabs' |
And finally there is an Action to set the value of the variable:
=if(vShowDev = 0, 1, 0) |
The toggle on the screen looks inconspicuously like this:
![]()
All that is left then is to put the Conditional Show criteria on the correct sheets. The code for this is simply:
vShowDev = 1 |
Show Different Views Based On Variable Values
Another example of a show/hide toggle is where you want to swap between different charts or tables. Natively QlikView has the Auto-Minimise tick box and more recently the Container, but I am not a fan of using these. With a Conditional Show one object can be hidden and be replaced with a number of other objects.
To do a multi-way toggle I will set color variables up in the load script:
let vColHighlight = rgb(210, 255, 210); let vColNoHighlight = rgb(255, 255, 255); |
And default a display variable:
let vViewMode = 'Dashboard'; |
Text Areas are then required for each of the values you wish to set. Each text box simply has the legend of the view mode, and an Action to set the variable to the correct value:
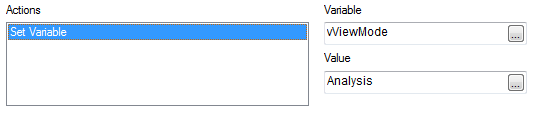
The final step is to highlight which button is presently active. This is done by setting the Background Colour on each Text Object to a dynamic colour with the following code:
if(vViewMode = 'Analysis', $(vColHighlight), $(vColNoHighlight)) |
With a bit of sizing and alignment the row of toggle buttons should look a bit like this:
![]()
Again, a simple Show Conditional expression is required on each chart to dictate under which heading it displays. The code for this will be:
vViewMode = 'Analysis' |
- Mark as New
- Bookmark
- Subscribe
- Mute
- Subscribe to RSS Feed
- Permalink
- Report Inappropriate Content
its Working...
Thankyou Gysbert Wassenaar
- Mark as New
- Bookmark
- Subscribe
- Mute
- Subscribe to RSS Feed
- Permalink
- Report Inappropriate Content
Hi ,
The easiest way is enabling Auto minimize option.