Unlock a world of possibilities! Login now and discover the exclusive benefits awaiting you.
- Qlik Community
- :
- All Forums
- :
- QlikView App Dev
- :
- how to use the same colours
- Subscribe to RSS Feed
- Mark Topic as New
- Mark Topic as Read
- Float this Topic for Current User
- Bookmark
- Subscribe
- Mute
- Printer Friendly Page
- Mark as New
- Bookmark
- Subscribe
- Mute
- Subscribe to RSS Feed
- Permalink
- Report Inappropriate Content
how to use the same colours
I have a list of clients, their location (X,Y coordinate) and their market segment. I have plotted these clients over a map in a scatter plot diagram. So far so good.
Now I want to assign a specific colour to a market segment, so if I select the market segment view I see the same clients, but then coloured according the market.
I have really no Idea how to solve it. an example of my issue is in the appendix.
Who can give me the clue?
regards
perry
Accepted Solutions
- Mark as New
- Bookmark
- Subscribe
- Mute
- Subscribe to RSS Feed
- Permalink
- Report Inappropriate Content
How many segments do you have?
If it's not too many you could create an IF statement
Add it here
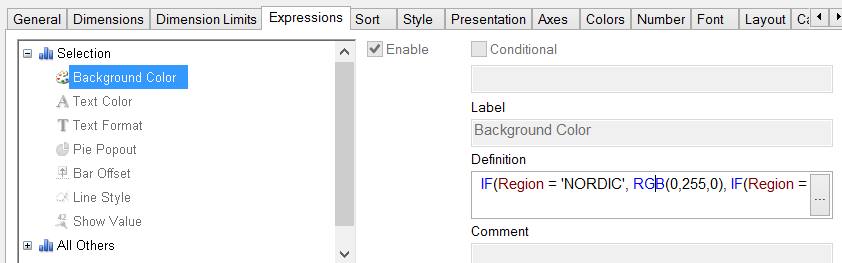
IF(MarketSeg = 1, RGB(0,255,0),
IF(MarketSeg = 2, RGB(255,200,200),
IF(MarketSeg = 3, RGB(0,100,50),
RED())))
- Mark as New
- Bookmark
- Subscribe
- Mute
- Subscribe to RSS Feed
- Permalink
- Report Inappropriate Content
How many segments do you have?
If it's not too many you could create an IF statement
Add it here
IF(MarketSeg = 1, RGB(0,255,0),
IF(MarketSeg = 2, RGB(255,200,200),
IF(MarketSeg = 3, RGB(0,100,50),
RED())))
- Mark as New
- Bookmark
- Subscribe
- Mute
- Subscribe to RSS Feed
- Permalink
- Report Inappropriate Content
Thanks a lot! I only have a limited amount of segments and it works perfectly.
thanks for your help.
perry
- Mark as New
- Bookmark
- Subscribe
- Mute
- Subscribe to RSS Feed
- Permalink
- Report Inappropriate Content
no problem, glad it helped
- Mark as New
- Bookmark
- Subscribe
- Mute
- Subscribe to RSS Feed
- Permalink
- Report Inappropriate Content
Yeah the IF condition was the best and easy way for it. I too had tried it and it was successful for me too.