Unlock a world of possibilities! Login now and discover the exclusive benefits awaiting you.
- Qlik Community
- :
- All Forums
- :
- QlikView App Dev
- :
- labels truncated in chart
- Subscribe to RSS Feed
- Mark Topic as New
- Mark Topic as Read
- Float this Topic for Current User
- Bookmark
- Subscribe
- Mute
- Printer Friendly Page
- Mark as New
- Bookmark
- Subscribe
- Mute
- Subscribe to RSS Feed
- Permalink
- Report Inappropriate Content
labels truncated in chart
hello
You will find a sample in the attached qvw.
The problem is :
I have a label which is the concatenation of two texts and I want i to be displayed on the points of data. The problem is that this label may be truncated (see value for key b)/
as you can see, the chart is sized to the maximum.
I also tried :
create another column with value multiplied by a factor (eg: 1.5 , 2 , ....)
fix a max scale value in axis / scale
it seems to work but there is always a case where label is truncated.
I have the same problem with vertical bars where label is split on 2 lines.
Any ideas ?
- Mark as New
- Bookmark
- Subscribe
- Mute
- Subscribe to RSS Feed
- Permalink
- Report Inappropriate Content
try like this:
- Mark as New
- Bookmark
- Subscribe
- Mute
- Subscribe to RSS Feed
- Permalink
- Report Inappropriate Content
hello
as I said, I already tried it and it seems to work but there is always a value which make the label to be truncated
- Mark as New
- Bookmark
- Subscribe
- Mute
- Subscribe to RSS Feed
- Permalink
- Report Inappropriate Content
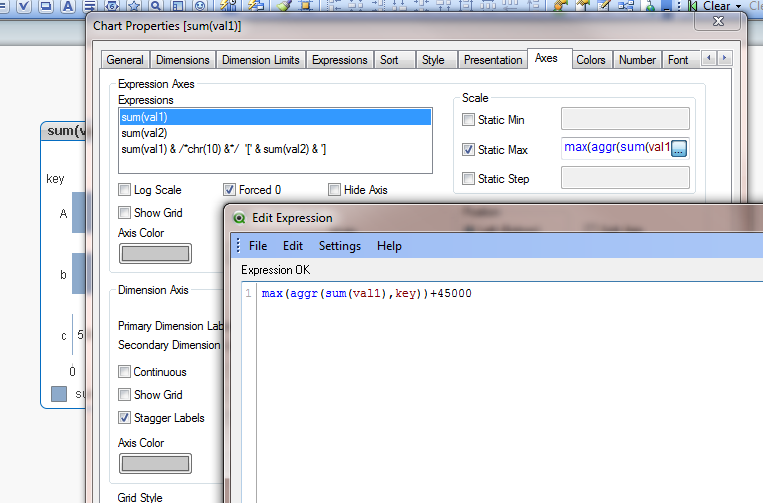
No easy workaround other than reserving enough space. You could also use
Max(Aggr(Sum(val1),key)) * 1.3
Adjust the factor as required
- Mark as New
- Bookmark
- Subscribe
- Mute
- Subscribe to RSS Feed
- Permalink
- Report Inappropriate Content
and when you also take into regard the length of the visible text ?
static max formula for sum(val1) :
max(aggr(sum(val1),key)) * len(sum(val1)&sum(val1))