Unlock a world of possibilities! Login now and discover the exclusive benefits awaiting you.
- Qlik Community
- :
- All Forums
- :
- QlikView App Dev
- :
- Re: need help on set analysis - compute growth%
- Subscribe to RSS Feed
- Mark Topic as New
- Mark Topic as Read
- Float this Topic for Current User
- Bookmark
- Subscribe
- Mute
- Printer Friendly Page
- Mark as New
- Bookmark
- Subscribe
- Mute
- Subscribe to RSS Feed
- Permalink
- Report Inappropriate Content
need help on set analysis - compute growth%
hi guys need help on this. im new in ste analysis maybe you can give pointers on my prob
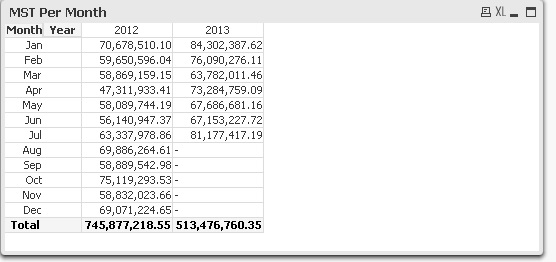
i have this QVchart with year and month dimension, i nneed to compute the growth percentage in comparing the value of each month for this year and previous year.
see image below
- Mark as New
- Bookmark
- Subscribe
- Mute
- Subscribe to RSS Feed
- Permalink
- Report Inappropriate Content
You dont need to use set analysis.
If you have that chart already all you need to do is create this expression as well.
(2013 - 2012)
/
2012
and show in percentage.
- Mark as New
- Bookmark
- Subscribe
- Mute
- Subscribe to RSS Feed
- Permalink
- Report Inappropriate Content
its a pivot chart but the dimension is (in table i mean)
2012, jan
2012, feb
2013, jan
2013, feb
- Mark as New
- Bookmark
- Subscribe
- Mute
- Subscribe to RSS Feed
- Permalink
- Report Inappropriate Content
do i need to create a tbale that will define the previous month year
- Mark as New
- Bookmark
- Subscribe
- Mute
- Subscribe to RSS Feed
- Permalink
- Report Inappropriate Content
Hello,
This can't be achieved using Set Analysis i believe. Because, set analysis works once for an object, i.e, it would not produce different results based on your dimension values. You have to work in the script; use some sort of As-of-Date concept or a linkage table. PFA, it might give you an idea.
Update: This link would be helpful. Look at the attachment by milda113.
- Mark as New
- Bookmark
- Subscribe
- Mute
- Subscribe to RSS Feed
- Permalink
- Report Inappropriate Content
Ok you can try using the above function.
something like this for the 2012 increases:
(
Column(2)
-
Above(Column(2))
)
/
Above(Column(2))
- Mark as New
- Bookmark
- Subscribe
- Mute
- Subscribe to RSS Feed
- Permalink
- Report Inappropriate Content
Nice question , you said you want to do compare by pivot chart but you show in table , i think you mean pivot table right ?
- Mark as New
- Bookmark
- Subscribe
- Mute
- Subscribe to RSS Feed
- Permalink
- Report Inappropriate Content
yes i use pivot table..
- Mark as New
- Bookmark
- Subscribe
- Mute
- Subscribe to RSS Feed
- Permalink
- Report Inappropriate Content
Hi Sir
What I mean is qliktech employ how many ppl to develop the software ?
Sent from Samsung Mobile
- Mark as New
- Bookmark
- Subscribe
- Mute
- Subscribe to RSS Feed
- Permalink
- Report Inappropriate Content
base on my experience you can develop a simple to a little advance qvw apps.. but there are so man details to take in consideration when you are working alone.
im using qv in 2 years now and what im lacking for is the GUI deign aspect and some few data model expertise. but if your apps is more on aggregation and as reporting tool, QV is the most effective reporting tool for me..
FYI:
i hooked up to the ff data source:
MS Sql
mySql
xls and flat files like txt file and csv file