Unlock a world of possibilities! Login now and discover the exclusive benefits awaiting you.
- Qlik Community
- :
- All Forums
- :
- QlikView App Dev
- :
- showing only selected year in chart with a 2nd mea...
- Subscribe to RSS Feed
- Mark Topic as New
- Mark Topic as Read
- Float this Topic for Current User
- Bookmark
- Subscribe
- Mute
- Printer Friendly Page
- Mark as New
- Bookmark
- Subscribe
- Mute
- Subscribe to RSS Feed
- Permalink
- Report Inappropriate Content
showing only selected year in chart with a 2nd measure showing LY
Hi,
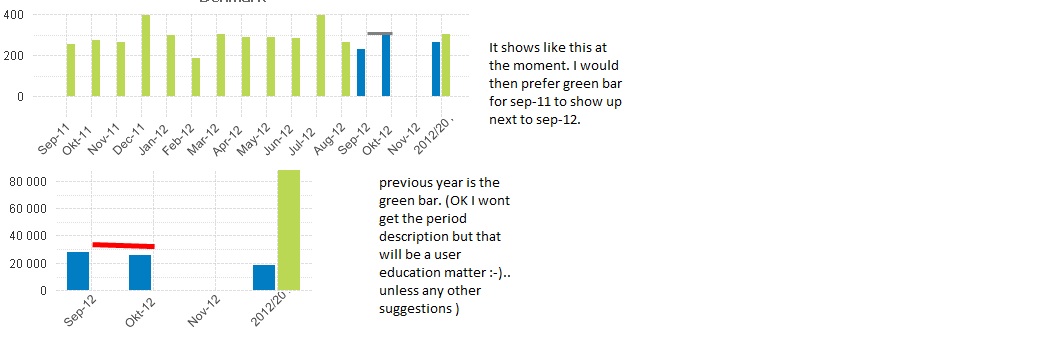
i am trying to create a chart that shows actuals, Rolling 12 with actual total and Last Year total. I have used the dimension total for actuals. I would now also like to show the total of last Year.
I tried to create a 3rd measure selecting last year. Then I need to disregard the current selection on year in my set so I do. Then I do get at total that would be fine (I think) but unfortunately all periods included in the "previouis year selection" shows in the chart. I would prefer to only see the total but if this is not possible then I would like for the measure to show up "ontop of my currently selected year"
Is there any way of doing this? It is not unusual that you like to compare this year with last year (almost as budget only connected to another year")
Bottom picture is the one I would like to acheive 
Thank you for any suggestions!
- Mark as New
- Bookmark
- Subscribe
- Mute
- Subscribe to RSS Feed
- Permalink
- Report Inappropriate Content
Hmmm I see your point. For the last year total expression, try writing something like this:
aggr(
sum({<last year set analysis>} metric),
Year
)
I think that should force it to show up once, since aggr by default is distinct over dimensions--so would only show up once because the aggr() dimension is year and the chart dimension is month.
Not positive this will work, but give it a shot.
Vlad
- Mark as New
- Bookmark
- Subscribe
- Mute
- Subscribe to RSS Feed
- Permalink
- Report Inappropriate Content
Hello Vlad,
thank you for your suggestion. Unfortunately it did not help it removed the previous year totally. So temporary I do two charts next to eachother...
Thank you for your time