Unlock a world of possibilities! Login now and discover the exclusive benefits awaiting you.
- Qlik Community
- :
- All Forums
- :
- QlikView App Dev
- :
- vertical line in a chart with date as the x axis
- Subscribe to RSS Feed
- Mark Topic as New
- Mark Topic as Read
- Float this Topic for Current User
- Bookmark
- Subscribe
- Mute
- Printer Friendly Page
- Mark as New
- Bookmark
- Subscribe
- Mute
- Subscribe to RSS Feed
- Permalink
- Report Inappropriate Content
vertical line in a chart with date as the x axis
Hi all
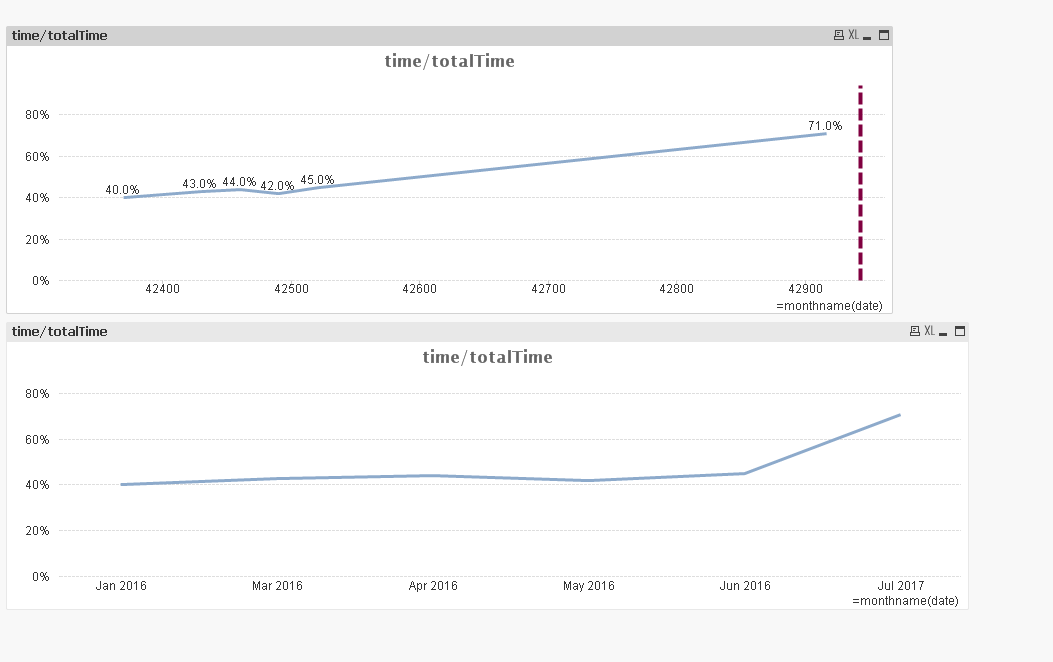
I am looking at something like this: but I want to show that before 1 July 2017 - the assumptions behind the figures changed - hence the vertical line.
I can only add the line if I make the x axis "continuous" and then the x axis ignores the format monthname(date).
I suppose I could do it by doing an overlay but is there a simpler way???
Jo
Accepted Solutions
- Mark as New
- Bookmark
- Subscribe
- Mute
- Subscribe to RSS Feed
- Permalink
- Report Inappropriate Content
It's because the expression that you're using is a date but the dimension that you're using is a month. If you also wrap your expression for the vertical line in MonthName(), it appears on the chart.
- Mark as New
- Bookmark
- Subscribe
- Mute
- Subscribe to RSS Feed
- Permalink
- Report Inappropriate Content
ah ... monthname(date(42950))
thank you!
Jo
- Mark as New
- Bookmark
- Subscribe
- Mute
- Subscribe to RSS Feed
- Permalink
- Report Inappropriate Content
Hi Nicole
I still get a problem though when I try to show the x axis as a month - I need to show it as "continuous" and then it defaults to a number rather than the formatted axis my dimension is:
monthname (date(AppointmentDate)) or monthname (AppointmentDate) - neither work
Ahh... so when I make it continuous - the date then appears in NUMBER tab and there i can change the format to be MMM/yyyy
