Unlock a world of possibilities! Login now and discover the exclusive benefits awaiting you.
- Qlik Community
- :
- All Forums
- :
- QlikView App Dev
- :
- why has my axis moved to the right?
- Subscribe to RSS Feed
- Mark Topic as New
- Mark Topic as Read
- Float this Topic for Current User
- Bookmark
- Subscribe
- Mute
- Printer Friendly Page
- Mark as New
- Bookmark
- Subscribe
- Mute
- Subscribe to RSS Feed
- Permalink
- Report Inappropriate Content
why has my axis moved to the right?
Hi all
why has my y axis moved to the right?
Is there any way of forcing it to the left?
I have a split axis.
Jo
Accepted Solutions
- Mark as New
- Bookmark
- Subscribe
- Mute
- Subscribe to RSS Feed
- Permalink
- Report Inappropriate Content
why not try a work around .
take a snap shot of legend u want to show(in the particular order of appearence) and then use it as back ground of a text box and place it on top of chart and hide the legend.
it will do the job as it did for me in a specific case.
- Mark as New
- Bookmark
- Subscribe
- Mute
- Subscribe to RSS Feed
- Permalink
- Report Inappropriate Content
Hi Josephinet,
See if the axes is on the primary or secondary position (as the image bellow).
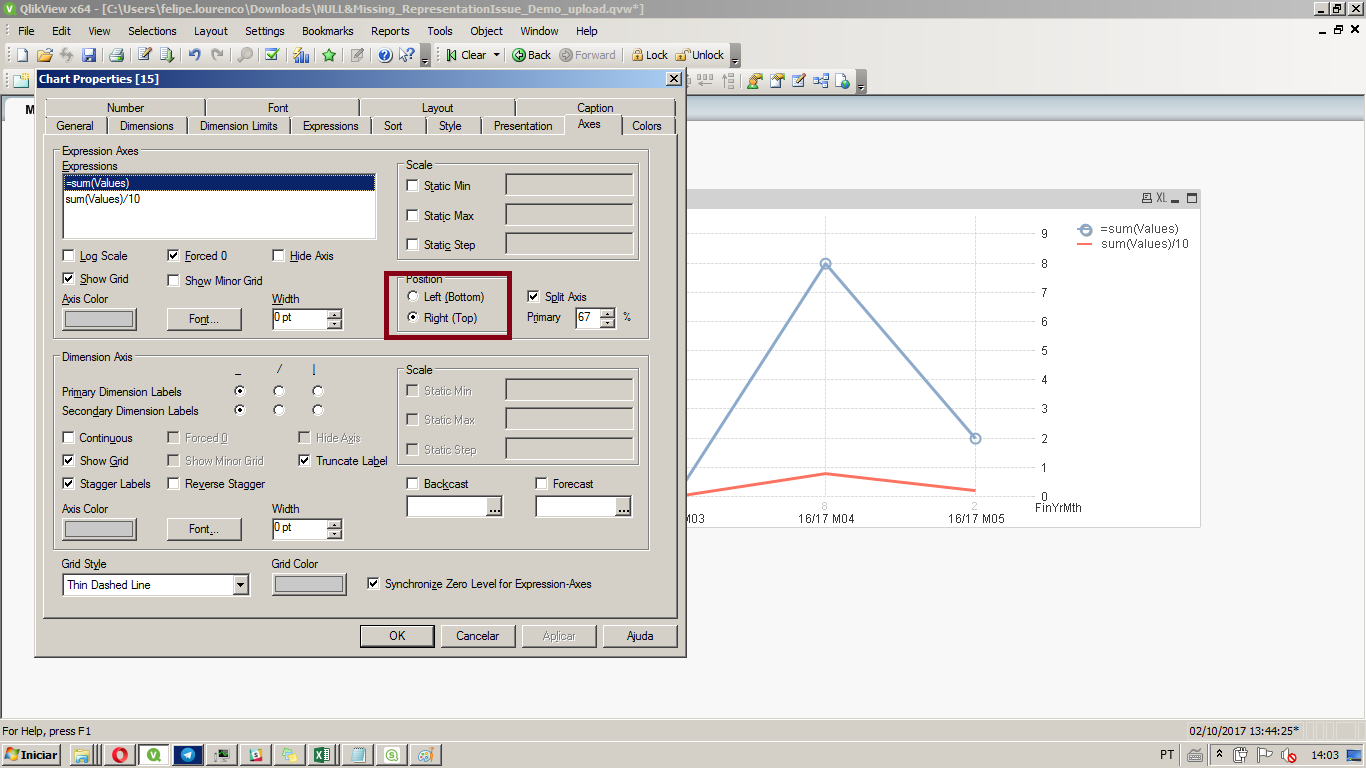
That way you can align it to the left.
Felipe.
- Mark as New
- Bookmark
- Subscribe
- Mute
- Subscribe to RSS Feed
- Permalink
- Report Inappropriate Content
Hi Filipe
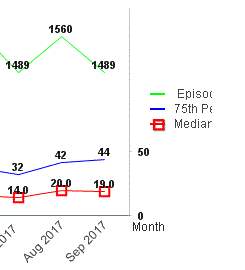
as you can see - I made the Episodes axis top right (but hid the axis) and the other 2 expressions left bottom - but the axis still stays on the bottom right ..!.
- Mark as New
- Bookmark
- Subscribe
- Mute
- Subscribe to RSS Feed
- Permalink
- Report Inappropriate Content
It gets the orientation of the first expression, I've tested it here with 3 expression, hiding as you did, and it maintained the first (Right in my case) as you have on your "Episodes" axes.
Instead of hiding it, just change the order of your expression. Get "Median(Mins)" or "75th Percentile" above "Episodes".
FElipe.
- Mark as New
- Bookmark
- Subscribe
- Mute
- Subscribe to RSS Feed
- Permalink
- Report Inappropriate Content
ahhh... I see - but then ..
The reason I moved the expressions around was so that the legend matched the order of the appearance in the chart. So is it a choice between mathematics and aesthetics?
Jo
- Mark as New
- Bookmark
- Subscribe
- Mute
- Subscribe to RSS Feed
- Permalink
- Report Inappropriate Content
why not try a work around .
take a snap shot of legend u want to show(in the particular order of appearence) and then use it as back ground of a text box and place it on top of chart and hide the legend.
it will do the job as it did for me in a specific case.
- Mark as New
- Bookmark
- Subscribe
- Mute
- Subscribe to RSS Feed
- Permalink
- Report Inappropriate Content
Thank you Pradosh
I think a workaround is needed - Jo