Unlock a world of possibilities! Login now and discover the exclusive benefits awaiting you.
- Qlik Community
- :
- All Forums
- :
- QlikView App Dev
- :
- Re: x axis -2 dimensions
- Subscribe to RSS Feed
- Mark Topic as New
- Mark Topic as Read
- Float this Topic for Current User
- Bookmark
- Subscribe
- Mute
- Printer Friendly Page
- Mark as New
- Bookmark
- Subscribe
- Mute
- Subscribe to RSS Feed
- Permalink
- Report Inappropriate Content
x axis -2 dimensions
 Hi All
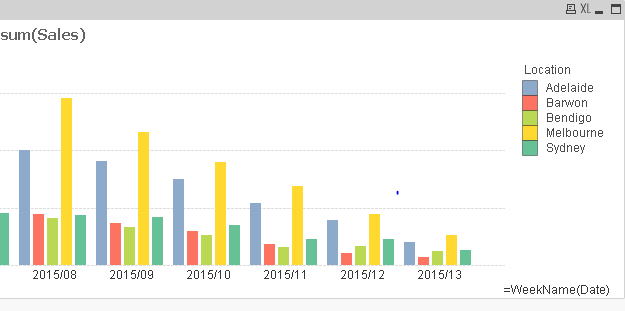
I have a chart which has 2 dimensions on the x axis. I have combined them using =Weeknum(dateSale} & '-'& Location.
however I have been asked if I can show the Weeknum(dateSale) and then have Location also on the x axis rather than coming up as a legend. I have not been able to do this - any hints for what I can try? The idea would be to have the Location as vertical below the date. Not sure if this is possible ...
Jo
Accepted Solutions
- Mark as New
- Bookmark
- Subscribe
- Mute
- Subscribe to RSS Feed
- Permalink
- Report Inappropriate Content
Yes it is possible.
1. Edit the chart and add a second expression with just a value of 0.A new legend will appear.
2. Open the properties and go to the Presentation tab. Deselect the Show Legend option:

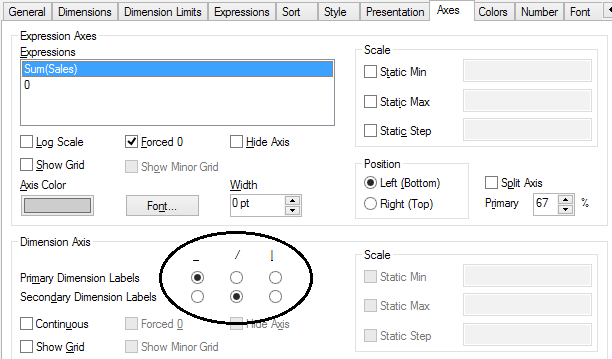
To show location as vertical below date:
Edit the properties of the chart and go to the Axes tab. Set the Secondary Dimension Labels to the / option as shown in the following screenshot:
- Mark as New
- Bookmark
- Subscribe
- Mute
- Subscribe to RSS Feed
- Permalink
- Report Inappropriate Content
Yes it is possible.
1. Edit the chart and add a second expression with just a value of 0.A new legend will appear.
2. Open the properties and go to the Presentation tab. Deselect the Show Legend option:
To show location as vertical below date:
Edit the properties of the chart and go to the Axes tab. Set the Secondary Dimension Labels to the / option as shown in the following screenshot:
- Mark as New
- Bookmark
- Subscribe
- Mute
- Subscribe to RSS Feed
- Permalink
- Report Inappropriate Content
Thank you it is exactly what I wanted, but i am not surehow to do the "Answered"
Thank you again
Jo
- Mark as New
- Bookmark
- Subscribe
- Mute
- Subscribe to RSS Feed
- Permalink
- Report Inappropriate Content
you will get two buttons at the bottom of my reply like below. you can press on "correct answer" button.
