Unlock a world of possibilities! Login now and discover the exclusive benefits awaiting you.
- Qlik Community
- :
- All Forums
- :
- QlikView Administration
- :
- Governance Dashboard: Why do you use other system ...
- Subscribe to RSS Feed
- Mark Topic as New
- Mark Topic as Read
- Float this Topic for Current User
- Bookmark
- Subscribe
- Mute
- Printer Friendly Page
- Mark as New
- Bookmark
- Subscribe
- Mute
- Subscribe to RSS Feed
- Permalink
- Report Inappropriate Content
Governance Dashboard: Why do you use other system tools (as well)?
I am seeking your feedback on on the QlikView Governance Dashboard 1.0 GA available on QlikMarket and on the QlikView download site.
As you may or may not know, the Governance Dashboard provides visibility into your QlikView deployment, showing operational statistics for server and publisher and also extensive metadata about QVWs, QVDs, QVXs including data lineage, sheet objects, expressions, etc.
For those currently using the Dashboard (or who have deliberately chosen not to use the Dashboard), I am interested in knowing why you use other tools (e.g. Ops Monitor, MetaScanner, or a home grown/other tool(s)) to monitor and manage your QlikView deployment. Any feedback and questions would be great! I will use this feedback in prioritizing and, where needed, augmenting open requests for future releases of the Dashboard.
Thank you! Gracias! Obrigado!
Tyler
- « Previous Replies
-
- 1
- 2
- Next Replies »
- Mark as New
- Bookmark
- Subscribe
- Mute
- Subscribe to RSS Feed
- Permalink
- Report Inappropriate Content
Hello
Can't use this tool as need password to see what in hidden script.
Hugo
- Mark as New
- Bookmark
- Subscribe
- Mute
- Subscribe to RSS Feed
- Permalink
- Report Inappropriate Content
Hugo - this is a common question. At this point, the script is hidden to protect the Intellectual Property (IP).
Assuming you could 'unlock' the script, what would you want to do with it? Or, what specific things would you do differently with the load script that perhaps are missing or incomplete?
Thanks!
Tyler
- Mark as New
- Bookmark
- Subscribe
- Mute
- Subscribe to RSS Feed
- Permalink
- Report Inappropriate Content
Hi Tyler,
I like the idea of the GD. I've told my customers about it, but have yet to convert any of my customers to it. I wind up installing my tried and true homegrown stuff, because it's fast and known. I would like to get customers converted to GD because I believe it's best in the long run. Here's some reasons I' have not gotten them converted.
1. Have not been able to get it to actually scan successfully when Publisher and Server logs are on two different machines.
2. The analysis dashboard is wonderfully rich for an administrator, but intimidating looking for some applications of metadata. I use several more focused and simpler dashboards to meet the needs of different audiences.
For example, I find that everyone in an organization is interested in tracking qvw usage. Sponsors and developers want to see the uptake of their investment. Peers want to find out who else in their department is using dashboard X. Information Security analysts want to audit. These groups only care about a simple lookup of usage, they are not interested in QVDs, performance, event logs, expressions.
Developers want to drill into thier QVD farm to find the right field and QVD quickly. Modelers want a slightly different view of the QVDS. They too benefit from a focused view.
Conceivably, these more focused dashboards could be created by the output of the GD scan. I may get around to that 
3. There is still some confusion about the Expressor product and it's relationship to Qlikview. The binary nature (and the hidden script) of part of the scan puts some customers and consultants off. The memory of the never-quite-clear-status of the metascanner and the seemingly long time to take the GD from beta to GA has not created confidence.
I hope those are useful thoughts. I'm excited to see the GD growing!
-Rob
- Mark as New
- Bookmark
- Subscribe
- Mute
- Subscribe to RSS Feed
- Permalink
- Report Inappropriate Content
Rob,
An insightful answer - as I expected. Thank you for taking the time to respond and for making the effort to use the Governance Dashboard.
I am curious about your statement
1. Have not been able to get it to actually scan successfully when Publisher and Server logs are on two different machines.
Do you have any specific examples of this? I 've not seen this in our testing nor with customers, so if this is an issue, I'd like to investigate further.
One note is to be sure to use the latest version of the dashboard (1.0.1) which addresses a 'frozen' reload state when there are more than 200 TaskResult files being scanned.
2. The analysis dashboard is wonderfully rich for an administrator, but intimidating looking for some applications of metadata. I use several more focused and simpler dashboards to meet the needs of different audiences.
For example, I find that everyone in an organization is interested in tracking qvw usage.
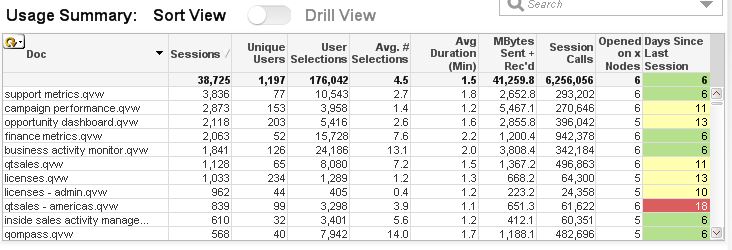
This is common feedback (and I agree!). I am working to add a simpler chart showing sessions / selections for either Documents or users (or both together). Does this look helpful / relevant? Anything you would remove, or add? (image in next reply)
- Mark as New
- Bookmark
- Subscribe
- Mute
- Subscribe to RSS Feed
- Permalink
- Report Inappropriate Content
- Mark as New
- Bookmark
- Subscribe
- Mute
- Subscribe to RSS Feed
- Permalink
- Report Inappropriate Content
Ok, I've resolved #1 by searching the forum. It's the problem of not supporting a UNC path without a subdirectory. I did a workaround by creating a new share one level up. I hope this can be fixed at some point where I don't have to create an extra share.
Your Uasge chart looks pretty good. A great addition will be a time chart -- line or bar -- showing usage over time. Perhaps a drill group for month and day. Expressions would be #users and #sessions.
I'm guessing your cycle group will cycle to username? That would be good.
Thanks! I'm looking at it again and becoming a fan.
-Rob
- Mark as New
- Bookmark
- Subscribe
- Mute
- Subscribe to RSS Feed
- Permalink
- Report Inappropriate Content
Yes - the UNC root limitation -- that's a tricky one!
The cyclic group does indeed cycle to username.
I am working to add a usage over time chart, as you've described, with some approximation of concurrency as well. That has been a very common request.
Thanks again Rob.
Tyler
- Mark as New
- Bookmark
- Subscribe
- Mute
- Subscribe to RSS Feed
- Permalink
- Report Inappropriate Content
If it's of any use to you, attached is the script I use to compute concurrent session counts.
-Rob
- Mark as New
- Bookmark
- Subscribe
- Mute
- Subscribe to RSS Feed
- Permalink
- Report Inappropriate Content
Hi Tyler
I use two dashboards to monitor Qlikview. The first is the governance dash and the second is a Qlikview Server Performance Dashboard. I use the the latter more than the first as it helps me to monitor the usage of each document I have deployed and essentially it lets me know how often users are accessing it and, critically, how many clicks they are taking to find the information they want.
I do have a requirement (provided by neither) where I want to simply see how many licences (I use document and user cals) I have in use and how many free licences I have to play with.
I'm currently on the lookout for an app that does this as currently I just keep the licence info on a spreadsheet and use a customer built app. It does mean I have to constantly update the spreadsheet though everytime I redistribute a licence which isn't ideal.
Hope this helps.
Stu
- « Previous Replies
-
- 1
- 2
- Next Replies »