Unlock a world of possibilities! Login now and discover the exclusive benefits awaiting you.
- Qlik Community
- :
- All Forums
- :
- QlikView Administration
- :
- Re: Verknüpfung von Abfrage mit Jahreszahl
- Subscribe to RSS Feed
- Mark Topic as New
- Mark Topic as Read
- Float this Topic for Current User
- Bookmark
- Subscribe
- Mute
- Printer Friendly Page
- Mark as New
- Bookmark
- Subscribe
- Mute
- Subscribe to RSS Feed
- Permalink
- Report Inappropriate Content
Verknüpfung von Abfrage mit Jahreszahl
Ich verwende in einer Tabelle als Formel den Inhalt einer Excel Datei mit 4 Zeilen
| %KPISV_DE | FormulaSV |
| Anzahl Aufträge | sum(AuftCounter) |
| Anzahl Fälle | sum(FallCounter) |
| Mittelwert Punkte | sum(Punkte)/ count(DISTINCT FallNr) |
| Punkte | sum(Punkte) |
In der Formel habe ich folgende Einträge:
Spalte 1: Bezeichnung: =%KPISV_DE und als Definition: =$(=FormulaSV)
Spalte 2: Bezeichnung: =Year(Today())-0 und als Definition: =$(=FormulaSV)
Splate 3: Bezeichnung: =Year(Today())-1 und als Definition: =$(=FormulaSV)
Splate 4: Bezeichnung: =Year(Today())-2 und als Definition: =$(=FormulaSV).
Damit bekomme ich auch bei entsprechender Anwahl der Kennzahlen Daten geladen, jedoch immer alle Daten. Ich möchte jetzt aber für die Spalten der Tabelle nur die Daten für das jeweilige Jahr auflisten. Also z.B.
Anzahl Aufträge 2014 2013 2012
5850 2387 1493 1970
Wer hat eine Lösung für mein Problem?
- Tags:
- qlikview_publisher
- Mark as New
- Bookmark
- Subscribe
- Mute
- Subscribe to RSS Feed
- Permalink
- Report Inappropriate Content
can you clarify your request, maybe by using some examples (short inline example)?
and translate your question in english, you will get far more responses
- Mark as New
- Bookmark
- Subscribe
- Mute
- Subscribe to RSS Feed
- Permalink
- Report Inappropriate Content
Wenn Du eine Pivot verwendest, könntest Du Jahr als Dimension einsetzen und einfach nach oben in die Horizontale ziehen. Ansonsten müsstest Du Deine Formeln modifizieren oder Du bräuchtest sie in mehreren Varianten, z.B. sum({< Jahr = {2014}>} AuftCounter) oder sum({< Jahr = {"$(max(Jahr))"}>} AuftCounter) oder ....
- Marcus
- Mark as New
- Bookmark
- Subscribe
- Mute
- Subscribe to RSS Feed
- Permalink
- Report Inappropriate Content
I use a table as a formula the contents of a excel file with 4 lines
% KPISV_DE
FormulaSV
number of orders
sum (AuftCounter)
number of cases
sum (case Counter)
average points
sum (points) / count (DISTINCT FallNr)
points
sum (points)
In Formula I have the following entries:
Column 1: name: =% KPISV_DE and as a definition: = $ (= FormulaSV)
Column 2: name: = Year (Today ()) - 0 and as a definition: = $ (= FormulaSV)
Splate 3: Designation: = Year (Today ()) - 1, and as a definition: = $ (= FormulaSV)
Splate 4: Designation: = Year (Today ()) - 2 and as a definition: = $ (= FormulaSV).
So I get even with appropriate selection of the indicators data loaded, but always all data. I want now but only list the data for each year for the columns of the table. So, for example,
Number of Orders 2014 2013 2012
5850 2387 1493 1970
Who has a solution for my problem?
- Mark as New
- Bookmark
- Subscribe
- Mute
- Subscribe to RSS Feed
- Permalink
- Report Inappropriate Content
Hi
if I have understood your question correctly
You need to use set analysis,
Sum({<Year={"2014"}>}Points)
will give you the points for the year 2014
- Mark as New
- Bookmark
- Subscribe
- Mute
- Subscribe to RSS Feed
- Permalink
- Report Inappropriate Content
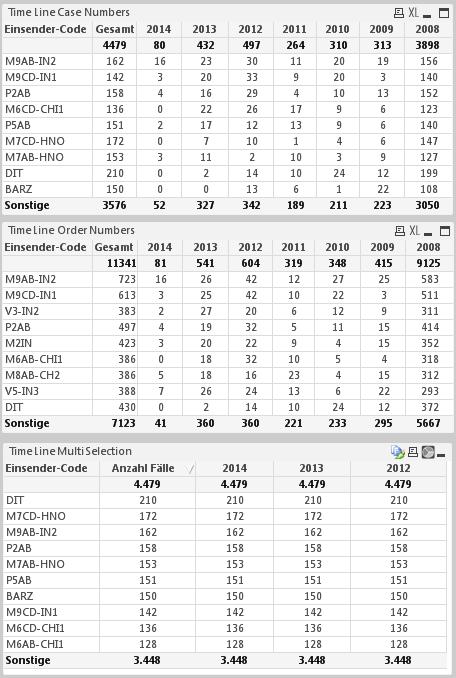
Thanks, that was my first way to do (see screenshot Time Line Case Number), but then I need more then one table. One for Sum({<Year={"2014"}>}Points) one for Sum({<Year={"2014"}>}AuftCounter) and one for Sum({<Year={"2014"}>}CaseCounter). What I need is one table and the entries should be changed by changing the KPI's. See screenshot Multi selection. It works but everytime with all data.
- Mark as New
- Bookmark
- Subscribe
- Mute
- Subscribe to RSS Feed
- Permalink
- Report Inappropriate Content
You could work with expression-groups and/or conditions on your expressions. Then you could show all in a single table.
- Marcus
- Mark as New
- Bookmark
- Subscribe
- Mute
- Subscribe to RSS Feed
- Permalink
- Report Inappropriate Content
HI
in your script do an inline load
* INLINE [
MeasureName, Measure
"Points", "PointValue"
"#CaseCounter", "AmountofCases"
];
Then Create a variable
vMeasure=Measure
In your expression of your table use the expression Sum({<Year={"2014"}>}$(vMeasure))
create a list box using Measure Name, now what ever you select in that listbox will be displayed in the tables