Unlock a world of possibilities! Login now and discover the exclusive benefits awaiting you.
- Qlik Community
- :
- All Forums
- :
- QlikView Administration
- :
- Re: how to calculate total while populating null a...
- Subscribe to RSS Feed
- Mark Topic as New
- Mark Topic as Read
- Float this Topic for Current User
- Bookmark
- Subscribe
- Mute
- Printer Friendly Page
- Mark as New
- Bookmark
- Subscribe
- Mute
- Subscribe to RSS Feed
- Permalink
- Report Inappropriate Content
how to calculate total while populating null as '-' in the expressions.
Hi,
I have list of values which are missing or not present in database but is needed to be shown in the report as '-' (hyphen).
At the same time, need to calculate the total for those expression. But the total is not displaying correctly.
My expression uses : Value: aggr(sum(value),entity1,entity2) and Amount: aggr(sum(amount),entity1,entity2)
aggr has been added to show hyphen(-) for missing or null values.
for eg:
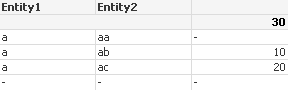
Expected Result
| Entity1 | Entity2 | Value | Amount |
|---|---|---|---|
| a | aa | - | 20 |
| a | ab | 10 | 40 |
| a | ac | 20 | - |
| total | 30 | 60 |
Actual Result
| Entity 1 | Entity 2 | Value | Amount |
|---|---|---|---|
| a | aa | - | 20 |
| a | ab | 10 | 40 |
| a | ac | 20 | - |
| total | - | - |
Any help would be great!!
- « Previous Replies
-
- 1
- 2
- Next Replies »
Accepted Solutions
- Mark as New
- Bookmark
- Subscribe
- Mute
- Subscribe to RSS Feed
- Permalink
- Report Inappropriate Content
Hi,
the problem in your expression is that your first if condition doesn't evaluate your field values if the are NULL. '' returns an empty string. Secondly you Null if condition is evaluated before dimensionality. In the data you presented this first condition is always true because sum(xy) always returns a "minimum" of 0.
Try this instead:
if(dimensionality()=0,
aggr( if( not IsNull (Spend) and not isnull(Value) and not IsNull (Percentile), (sum(Spend)-(sum(Value)*sum(Percentile)))), Entity2) ,
( aggr(Spend, Entity2)-(aggr(Value, Entity2)*aggr(Percentile, Entity2))))
but I would reccomend to create flag in script which indicates if all three values in one row are not null (if your value fields are in one table). For example
if( not IsNull (Spend) and not isnull(Value) and not IsNull (Percentile), 1) as NotNullFlag
your expression in chart could than be
if(Dimensionality() = 0,
(sum( { < NotNullFlag = {1} >} spend)-(sum( { < NotNullFlag = {1} >}value)*sum( { < NotNullFlag = {1} >} percentile))),
(only( { < NotNullFlag = {1} >} spend)-(only( { < NotNullFlag = {1} >}value)*only( { < NotNullFlag = {1} >} percentile)))
)
Given that your values return one value on level below totals.
depending on how much data you have this will be faster.
Best regards
Stefan
- Mark as New
- Bookmark
- Subscribe
- Mute
- Subscribe to RSS Feed
- Permalink
- Report Inappropriate Content
You can use a format string to present 0's as hyphens. On the Number tab of the properties window of the chart choose the Fixed to option and use as format string #,##0;#,##0;-
talk is cheap, supply exceeds demand
- Mark as New
- Bookmark
- Subscribe
- Mute
- Subscribe to RSS Feed
- Permalink
- Report Inappropriate Content
hi
this should work:
sum(aggr(sum( if ( not isnull(value), value)),entity1,entity2) and Amount: sum(aggr(sum(if not isnull(amount), amount)),entity1,entity2)
maybe you should skip entity1 as aggr parameter but this depends on your real data.
Best regards
Stefan
- Mark as New
- Bookmark
- Subscribe
- Mute
- Subscribe to RSS Feed
- Permalink
- Report Inappropriate Content
Thanks Gysbert for the reply.
the change in format helps to show the hyphen but doesn't show the correct total.
in order to show total i have to use : sum( aggr(sum(amount),entity1,entity2)).
But applying sum turns all '-' to 0's and then sums it up, which is not the expected output.
- Mark as New
- Bookmark
- Subscribe
- Mute
- Subscribe to RSS Feed
- Permalink
- Report Inappropriate Content
yes, and therefore you have to apply the not isnull part of the expression I posted. As aggr parameter you should use the field which contains the key for your lowest aggregation lvl of data.
Best Regards
Stefan
- Mark as New
- Bookmark
- Subscribe
- Mute
- Subscribe to RSS Feed
- Permalink
- Report Inappropriate Content
maybe with SetAnalysis and isNum(Value) condition
something like
sum(aggr({<isNum(Value)='-1'>}entity1,entity2))
- Mark as New
- Bookmark
- Subscribe
- Mute
- Subscribe to RSS Feed
- Permalink
- Report Inappropriate Content
yes, and therefore you have to apply the not isnull part of the expression I posted. As aggr parameter you should use the field which contains the key for your lowest aggregation lvl of data.
Best Regards
Stefan
Hi Stefan,
I tried your approach, but gives me correct total but it shows 0 values instead of '-' , which is not the expected output.
| Entity1 | Entity 2 | Value | Amount |
|---|---|---|---|
| a | aa | 0 | 20 |
| a | ab | 10 | 40 |
| a | ac | 20 | 0 |
| total | 30 | 60 |
- Mark as New
- Bookmark
- Subscribe
- Mute
- Subscribe to RSS Feed
- Permalink
- Report Inappropriate Content
did you use the whole expression including the if not isnull part?? Can you provide a sample app?
Best regards
Stefan
- Mark as New
- Bookmark
- Subscribe
- Mute
- Subscribe to RSS Feed
- Permalink
- Report Inappropriate Content
hi
ok, you were right. I found following solution:
pick(Dimensionality() +1,
sum(Value),
Null(),
if(not IsNull(Value), Sum(Value))
)
you can also only use " if(not IsNull(Value), Sum(Value))" changing the total mode of your expression to Sum of Rows.
Best
Stefan
- Mark as New
- Bookmark
- Subscribe
- Mute
- Subscribe to RSS Feed
- Permalink
- Report Inappropriate Content
Hi Stefan,
Sum of Rows is not available in Pivot table. I have to use Pivot table table instead of straight chart.
Also could you help me understand the dimensionality function used in the above expression.
Thanks,
Harshala
- « Previous Replies
-
- 1
- 2
- Next Replies »