Unlock a world of possibilities! Login now and discover the exclusive benefits awaiting you.
- Qlik Community
- :
- All Forums
- :
- QlikView App Dev
- :
- A question of Modelling with multiple fact tables?...
- Subscribe to RSS Feed
- Mark Topic as New
- Mark Topic as Read
- Float this Topic for Current User
- Bookmark
- Subscribe
- Mute
- Printer Friendly Page
- Mark as New
- Bookmark
- Subscribe
- Mute
- Subscribe to RSS Feed
- Permalink
- Report Inappropriate Content
A question of Modelling with multiple fact tables? Need help or direction
Hello,
I have what I think is a modelling issue. My current knowledge doesn't allow me to find a working and sustainable solution. I'm sure ou can help me find that solution, or at worst provide me direction to find it.
So here is my question.
I currently have the following model :
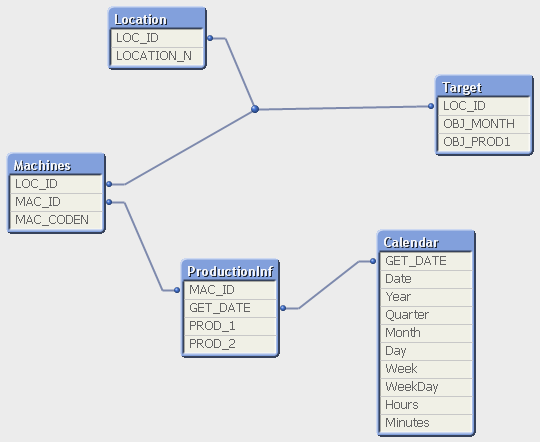
Basically, Target and ProductionInf would be fact tables and the others tables would be dimensions.
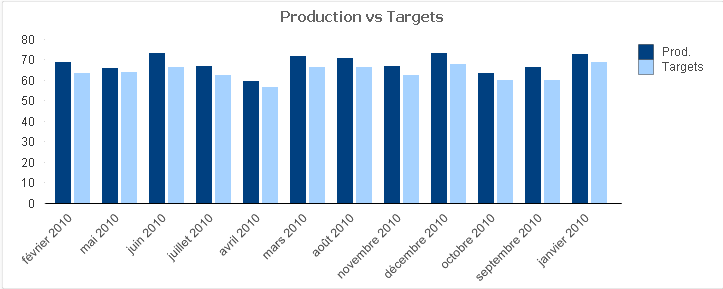
I need to design a graph that would look like the following which consists in comparing target value with actual production value:
My target is defined by location and month.
My production is defined by machine and every 10-minuts.
To do this graph I would need to join my target table to my calendar (the field OBJ_MONTH is a date).
Unfortunately, I have two different level of aggregation and a direct link would create a loop.
Do not hesitate to ask me questions if you think I was not clear enough.
I provide a QlikView app and source files with faked data in hope it will help for helping me.
Thanks for your help!!!
Damien.