Unlock a world of possibilities! Login now and discover the exclusive benefits awaiting you.
- Qlik Community
- :
- All Forums
- :
- QlikView App Dev
- :
- Aggr Help???
- Subscribe to RSS Feed
- Mark Topic as New
- Mark Topic as Read
- Float this Topic for Current User
- Bookmark
- Subscribe
- Mute
- Printer Friendly Page
- Mark as New
- Bookmark
- Subscribe
- Mute
- Subscribe to RSS Feed
- Permalink
- Report Inappropriate Content
Aggr Help???
Hi Folks,
I'm having below straight table , total here is "768"
Dim : Illustrator
Exp:
=(NetWorkDays(RangeMax(Min(TOTAL {<Illustrator>} Date), Max({<Illustrator>} StartedDate)), RangeMin(Max(TOTAL {<Illustrator>}Date), Max({<Illustrator>}EndDate)))*8)
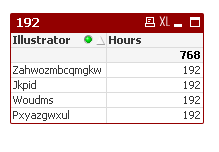
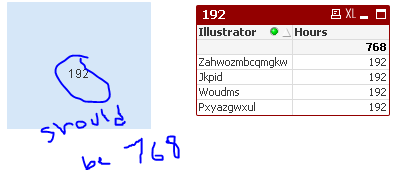
I want to use this total '768"in input box for some further calculation ,but not getting the exact numbers by using aggr function.
I'm trying something like below , but getting O/p as 192 , it should be "768".
=sum(Aggr((NetWorkDays(RangeMax(Min(TOTAL {<Illustrator>} Date), Max({<Illustrator>} StartedDate)), RangeMin(Max(TOTAL {<Illustrator>}Date), Max({<Illustrator>}EndDate)))*8),Illustrator))
Please help!
Regards,
AS
- Tags:
- qlikview_scripting
Accepted Solutions
- Mark as New
- Bookmark
- Subscribe
- Mute
- Subscribe to RSS Feed
- Permalink
- Report Inappropriate Content
Try this
=SUM({<Illustrator = P(Illustrator)>}Aggr(((NetWorkDays(
RangeMax(Min(TOTAL {<Illustrator>}Date),Max({<Illustrator>}StartedDate)),
RangeMin(Max(TOTAL {<Illustrator>}Date),Max({<Illustrator>}EndDate)))*8)
-vHolidays
),Illustrator))
- Mark as New
- Bookmark
- Subscribe
- Mute
- Subscribe to RSS Feed
- Permalink
- Report Inappropriate Content
Could you post your sample app to check?
- Mark as New
- Bookmark
- Subscribe
- Mute
- Subscribe to RSS Feed
- Permalink
- Report Inappropriate Content
Your syntax is OK. It looks like a problem with the data model with Illustrator not being correctly associated with the Date fields. Then 192 could be the correct result and 768 is just a table artifact created by summing the rows.
A sample app would certainly help.
- Mark as New
- Bookmark
- Subscribe
- Mute
- Subscribe to RSS Feed
- Permalink
- Report Inappropriate Content
Or try
Sum(Aggr(NoDistinct
(NetWorkDays(
RangeMax(Min(TOTAL {<Illustrator>} Date), Max({<Illustrator>} StartedDate)),
RangeMin(Max(TOTAL {<Illustrator>} Date), Max({<Illustrator>} EndDate))
)*8
), Illustrator))
- Mark as New
- Bookmark
- Subscribe
- Mute
- Subscribe to RSS Feed
- Permalink
- Report Inappropriate Content
PFA!
Thanks,AS
- Mark as New
- Bookmark
- Subscribe
- Mute
- Subscribe to RSS Feed
- Permalink
- Report Inappropriate Content
Sorry Jonathan,
Not working.
Thanks,
AS
- Mark as New
- Bookmark
- Subscribe
- Mute
- Subscribe to RSS Feed
- Permalink
- Report Inappropriate Content
May be try this
=((NetWorkDays(
RangeMax(Min(TOTAL {<Illustrator>}Date),Max({<Illustrator>}StartedDate)),
RangeMin(Max(TOTAL {<Illustrator>}Date),Max({<Illustrator>}EndDate)))*8)
-vHolidays
)*COUNT({<Illustrator>}DISTINCT TOTAL Illustrator)
- Mark as New
- Bookmark
- Subscribe
- Mute
- Subscribe to RSS Feed
- Permalink
- Report Inappropriate Content
Sorry Manish,
It is working just for 2018 , but if I select 2017 or other Years , numbers are different.

Thanks,
AS
- Mark as New
- Bookmark
- Subscribe
- Mute
- Subscribe to RSS Feed
- Permalink
- Report Inappropriate Content
Try this
=SUM({<Illustrator = P(Illustrator)>}Aggr(((NetWorkDays(
RangeMax(Min(TOTAL {<Illustrator>}Date),Max({<Illustrator>}StartedDate)),
RangeMin(Max(TOTAL {<Illustrator>}Date),Max({<Illustrator>}EndDate)))*8)
-vHolidays
),Illustrator))
- Mark as New
- Bookmark
- Subscribe
- Mute
- Subscribe to RSS Feed
- Permalink
- Report Inappropriate Content
Thanks Manish!
Regards,
AS