Unlock a world of possibilities! Login now and discover the exclusive benefits awaiting you.
- Qlik Community
- :
- All Forums
- :
- QlikView App Dev
- :
- Re: Bar chart with Quartile as dimension
- Subscribe to RSS Feed
- Mark Topic as New
- Mark Topic as Read
- Float this Topic for Current User
- Bookmark
- Subscribe
- Mute
- Printer Friendly Page
- Mark as New
- Bookmark
- Subscribe
- Mute
- Subscribe to RSS Feed
- Permalink
- Report Inappropriate Content
Bar chart with Quartile as dimension
Hi experts,
I have the following scenario in Qlik Sense:
- Customers who takes a certain period of time (in days) to receive Products.
I want to:
- Create a bar chart that uses quartile as dimension, and see the number of customers I have in each of the 4 quartiles.
I could do something by using valuelist, but valuelist does not respond to selecions. I need a responsive bar chart per quartile.
Is that possible to do?
Thank you in advance.
Rubens
- Tags:
- qlikview_scripting
- « Previous Replies
-
- 1
- 2
- Next Replies »
Accepted Solutions
- Mark as New
- Bookmark
- Subscribe
- Mute
- Subscribe to RSS Feed
- Permalink
- Report Inappropriate Content
Ignore selections within Fractile
Aggr(
If(Access_Time <= Fractile({<Customer_Code>}TOTAL Access_Time, 0.25), 'Quartile 1',
If(Access_Time <= Fractile({<Customer_Code>}TOTAL Access_Time, 0.50), 'Quartile 2',
If(Access_Time <= Fractile({<Customer_Code>}TOTAL Access_Time, 0.75), 'Quartile 3', 'Quartile 4'))), Customer_Code)
or this
Aggr(
If(Access_Time <= Fractile({<1>}TOTAL Access_Time, 0.25), 'Quartile 1',
If(Access_Time <= Fractile({<1>}TOTAL Access_Time, 0.50), 'Quartile 2',
If(Access_Time <= Fractile({<1>}TOTAL Access_Time, 0.75), 'Quartile 3', 'Quartile 4'))), Customer_Code)
- Mark as New
- Bookmark
- Subscribe
- Mute
- Subscribe to RSS Feed
- Permalink
- Report Inappropriate Content
What is the expression you use to calculate quartile? May be like this
Dimension
Aggr(YourExpression, Customers)
Expression
Count(DISTINCT Customers)
- Mark as New
- Bookmark
- Subscribe
- Mute
- Subscribe to RSS Feed
- Permalink
- Report Inappropriate Content
My expression is: E.g. 1st Quartile:
Count({< Access_Time = {"<=$(=Fractile(Access_Time , 0.25))"}>} Customer_Code)
I have two situation:
- Having a bar chart showing the Access time in the Y axis and the Quartiles in the X axis. When click on, e.g, quartile 1, it will respond to selection and group the customers that belong to this quartile. and so forth...
- Having a bar chart showing the Quantity of customers in the Y axis and the Quartiles in the X axis. When click on, e.g, quartile 1, it will respond to selection and group the customers that belong to this quartile. and so forth...
Is that possible to do?
Tks
- Mark as New
- Bookmark
- Subscribe
- Mute
- Subscribe to RSS Feed
- Permalink
- Report Inappropriate Content
I am not sure I follow... would you be able to share a sample?
- Mark as New
- Bookmark
- Subscribe
- Mute
- Subscribe to RSS Feed
- Permalink
- Report Inappropriate Content
Sure. I'll try to add here.
- Mark as New
- Bookmark
- Subscribe
- Mute
- Subscribe to RSS Feed
- Permalink
- Report Inappropriate Content
For example: Below I have the boxplot with my data:
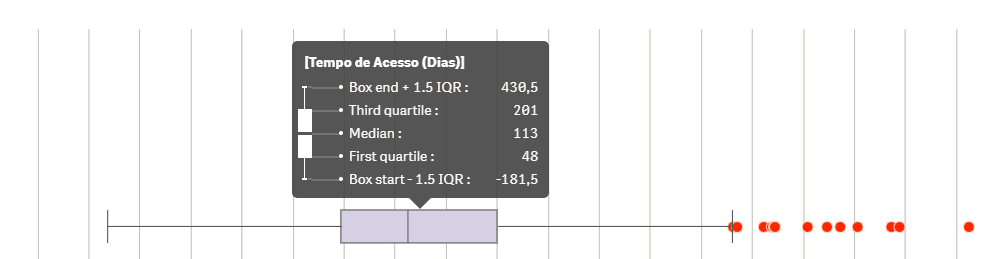
- The dots represent the Access Time;
- I want a responsive bar chart that represents the above boxplot. For example:
- The first quartile has the number 48. It means customers who take until 48 days to receive the Product. I expect the following in the bar chart: When I Click on Quartile 1, the selection will give me only the customers that belong to this quartile... and so forth with the other quartiles.
My problem is I don't know if it's possible to have a calculated dimension that can represents the quartiles.
Tks.
- Mark as New
- Bookmark
- Subscribe
- Mute
- Subscribe to RSS Feed
- Permalink
- Report Inappropriate Content
You def. need a calculated dimension here.... not 100% sure, but try this
Dimension:
Aggr(
If(Access_Time <= Fractile(TOTAL Access_Time, 0.25), 'Quartile 1',
If(Access_Time <= Fractile(TOTAL Access_Time, 0.50), 'Quartile 2',
If(Access_Time <= Fractile(TOTAL Access_Time, 0.75), 'Quartile 3', 'Quartile 4'))), Customer_Code)
Expression
Count(DISTINCT Customer_Code)
- Mark as New
- Bookmark
- Subscribe
- Mute
- Subscribe to RSS Feed
- Permalink
- Report Inappropriate Content
Hi Sunny,
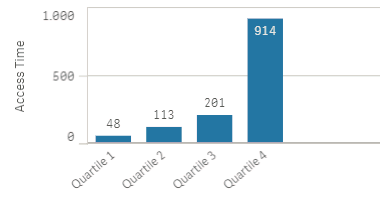
Your code really worked. I Only changed the Expression field. In instead of using Customer_Code, I'm using Max(Access_Time), and now I can have a boxplot quartile representation as follows:
However, When I click on any of those quartiles, the bar chart will recalculate new quartiles for the resulting set. For instance: If i click on quartile 1, the barchart will recalculate the result set and mount the 4 quartiles for it:
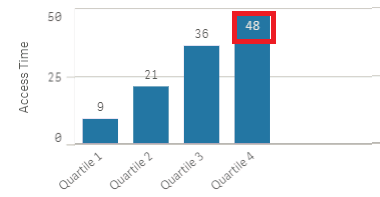
My question is:
- Is that possible to keep it static? I mean if I select quartile 1, it only show the quartile 1 bar and not recalculate the result set?
I do appreciate your help with this!
Rubens
- Mark as New
- Bookmark
- Subscribe
- Mute
- Subscribe to RSS Feed
- Permalink
- Report Inappropriate Content
Ignore selections within Fractile
Aggr(
If(Access_Time <= Fractile({<Customer_Code>}TOTAL Access_Time, 0.25), 'Quartile 1',
If(Access_Time <= Fractile({<Customer_Code>}TOTAL Access_Time, 0.50), 'Quartile 2',
If(Access_Time <= Fractile({<Customer_Code>}TOTAL Access_Time, 0.75), 'Quartile 3', 'Quartile 4'))), Customer_Code)
or this
Aggr(
If(Access_Time <= Fractile({<1>}TOTAL Access_Time, 0.25), 'Quartile 1',
If(Access_Time <= Fractile({<1>}TOTAL Access_Time, 0.50), 'Quartile 2',
If(Access_Time <= Fractile({<1>}TOTAL Access_Time, 0.75), 'Quartile 3', 'Quartile 4'))), Customer_Code)
- Mark as New
- Bookmark
- Subscribe
- Mute
- Subscribe to RSS Feed
- Permalink
- Report Inappropriate Content
Thank you Sunny! The first option worked as expected!!!
Just a curiosity, what does the formula parts below do?
Fractile({<Customer_Code>}TOTAL Access_Time, 0.25),
Tks again!
- « Previous Replies
-
- 1
- 2
- Next Replies »