Unlock a world of possibilities! Login now and discover the exclusive benefits awaiting you.
- Qlik Community
- :
- All Forums
- :
- QlikView App Dev
- :
- Re: CALCULATED COLUMN
- Subscribe to RSS Feed
- Mark Topic as New
- Mark Topic as Read
- Float this Topic for Current User
- Bookmark
- Subscribe
- Mute
- Printer Friendly Page
- Mark as New
- Bookmark
- Subscribe
- Mute
- Subscribe to RSS Feed
- Permalink
- Report Inappropriate Content
CALCULATED COLUMN
Hello,
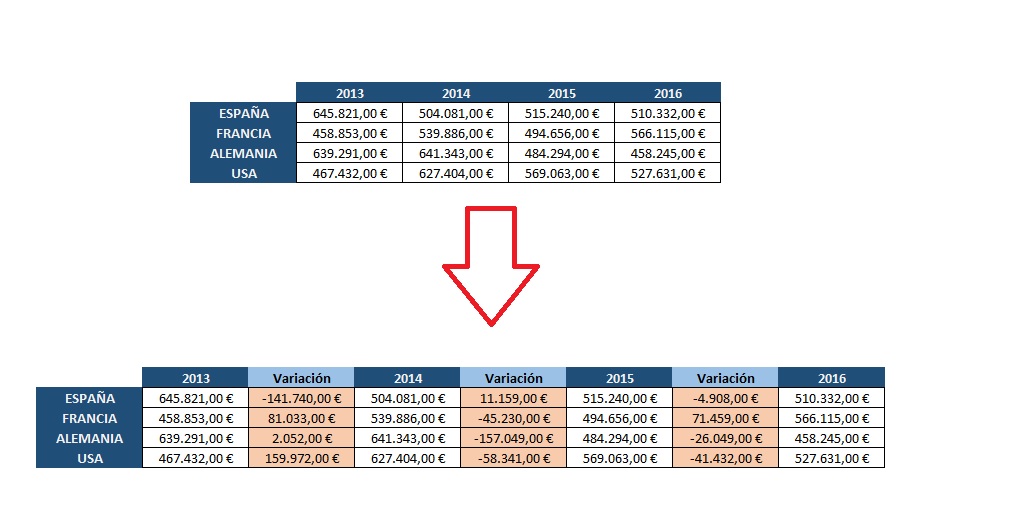
I have a pivot table with Years in "columns", "Countries" in rows and "Amount" as Measure.
We need to create a column between every element of dimension (Year) with the variation between 2016 with 2015, 2015 with 2014, 2014 with 2013...
Attach a image.
Can anyone help me?
Thank you in advance
Accepted Solutions
- Mark as New
- Bookmark
- Subscribe
- Mute
- Subscribe to RSS Feed
- Permalink
- Report Inappropriate Content
You can almost get what you want by using two expressions
1. Sum(Amount)
2. Sum(Amount)-Before(Sum(Amount)
talk is cheap, supply exceeds demand
- Mark as New
- Bookmark
- Subscribe
- Mute
- Subscribe to RSS Feed
- Permalink
- Report Inappropriate Content
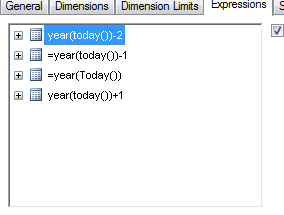
I would suggest something along the lines of having each year as an expression such as
year(today()) = 2015
year(today()) +1= 2016
year (today()) - 1 = 2014
year (today()) - 2 = 2013
etc.
and so forth depeneing how far you want to go back - this will allow the oldest year to roll off
you would also then create an expressions where you would subtract
year(today() - year(today()-1) using set analysis

you would then add your variation expression inbetween the year expressions
- Mark as New
- Bookmark
- Subscribe
- Mute
- Subscribe to RSS Feed
- Permalink
- Report Inappropriate Content
You can almost get what you want by using two expressions
1. Sum(Amount)
2. Sum(Amount)-Before(Sum(Amount)
talk is cheap, supply exceeds demand