Unlock a world of possibilities! Login now and discover the exclusive benefits awaiting you.
- Qlik Community
- :
- All Forums
- :
- QlikView App Dev
- :
- Change shape of indicators
- Subscribe to RSS Feed
- Mark Topic as New
- Mark Topic as Read
- Float this Topic for Current User
- Bookmark
- Subscribe
- Mute
- Printer Friendly Page
- Mark as New
- Bookmark
- Subscribe
- Mute
- Subscribe to RSS Feed
- Permalink
- Report Inappropriate Content
Change shape of indicators
Hi everyone
I have some data that is structured in a way that spreads indicators out over a number of fields. But I want to change the shape of that to bring that all into one field.
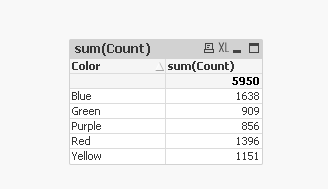
Please see attached sample data and target output.
Any advice much appreciated.
Thanks !
Stuart
- Tags:
- qlikview_scripting
- Mark as New
- Bookmark
- Subscribe
- Mute
- Subscribe to RSS Feed
- Permalink
- Report Inappropriate Content
Hi Stuart,
Look at crosstable functionality:
CROSSTABLE (Color,Number_Of_Items, 0)
LOAD *
FROM EXCEL_FILE;
Regards,
H
- Mark as New
- Bookmark
- Subscribe
- Mute
- Subscribe to RSS Feed
- Permalink
- Report Inappropriate Content
Try this:
Table1:
CrossTable(Color, Data)
LOAD Count,
Purple,
Green,
Yellow,
Red,
Blue
FROM
[..\YourexcelPath\Transform.xlsx]
(ooxml, embedded labels, table is Sheet1, filters(
Transpose(),
Rotate(right)
));
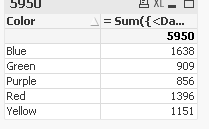
Use Straight table and add
Dim: Color
Expr: = Sum({<Data = {'1.000000'}>}Count)
- Mark as New
- Bookmark
- Subscribe
- Mute
- Subscribe to RSS Feed
- Permalink
- Report Inappropriate Content
Hi,
TABLE:
CrossTable(Color, Value)
LOAD num(Count) as Count,
Purple,
Green,
Yellow,
Red,
Blue
FROM
Transform.xlsx
(ooxml, embedded labels, table is Sheet1, filters(Transpose(),Rotate(right)));
NoConcatenate
sumary:
LOAD Color, NUM(Value) AS Value, Count Resident TABLE Where NUM(Value)>=1;
DROP Table TABLE;