Unlock a world of possibilities! Login now and discover the exclusive benefits awaiting you.
- Qlik Community
- :
- All Forums
- :
- QlikView App Dev
- :
- Chart Expression High Level Detail Showing Null
- Subscribe to RSS Feed
- Mark Topic as New
- Mark Topic as Read
- Float this Topic for Current User
- Bookmark
- Subscribe
- Mute
- Printer Friendly Page
- Mark as New
- Bookmark
- Subscribe
- Mute
- Subscribe to RSS Feed
- Permalink
- Report Inappropriate Content
Chart Expression High Level Detail Showing Null
Hi All,
I am trying to show the percentage of people who are present within the boundaries of greater than 0.5 but less that 5.
This is within a pivot table.
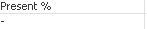
The first statement below works when the chart is expanded to the lowest level of detail. However when the detail is collapsed only a null appears.
Expression (Present %)
if (SUM({<[Present]={"True"}>}[Number])/SUM(People)*100 > 0.5
and SUM({<[Present]={"True"}>}[Number])/SUM(People)*100 < 5,
SUM({<[Present]={"True"}>}[Number])/SUM(People), Null())
Detail:
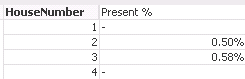
High Level:
I need the High level value to show the average of the rows with values i.e. 0.50 and 0.58
I have been playing around with the aggregation function but with no joy.
avg(aggr(
if(sum(sum({<[Present]={"True"}>}[Number])/Sum(People)*100) < 5
and sum(sum({<[Present]={"True"}>}[Number])/Sum(People)*100) > 0.5,
Sum({$<[Present]={"True"}>}[Number])/Sum(People))
,sum([Present])/Sum(People)))
Could someone point me in the right direction as to where I'm going wrong?
Thanks in Advance
Accepted Solutions
- Mark as New
- Bookmark
- Subscribe
- Mute
- Subscribe to RSS Feed
- Permalink
- Report Inappropriate Content
Try this:
avg(aggr(
if(sum({<[0-7TodayPresentFlag]={"True"}>}[<7TodayPresent])/Sum(People)*100 < 5
and sum({<[0-7TodayPresentFlag]={"True"}>}[<7TodayPresent])/Sum(People)*100 >= 0.5,
Sum({$<[0-7TodayPresentFlag]={"True"}>}[<7TodayPresent])/Sum(People)),
Location, Room))
- Mark as New
- Bookmark
- Subscribe
- Mute
- Subscribe to RSS Feed
- Permalink
- Report Inappropriate Content
Try this:
Avg(Aggr(
If(Sum({<[Present]={"True"}>}[Number])/Sum(People)*100 > 0.5
and Sum({<[Present]={"True"}>}[Number])/Sum(People)*100 < 5,
Sum({<[Present]={"True"}>}[Number])/Sum(People), Null())
, HouseNumber))
- Mark as New
- Bookmark
- Subscribe
- Mute
- Subscribe to RSS Feed
- Permalink
- Report Inappropriate Content
Can you share a sample app and expected out put for this please ?
- Mark as New
- Bookmark
- Subscribe
- Mute
- Subscribe to RSS Feed
- Permalink
- Report Inappropriate Content
I have attached a sample QVW with the data included.
The screenshot below might explain better.
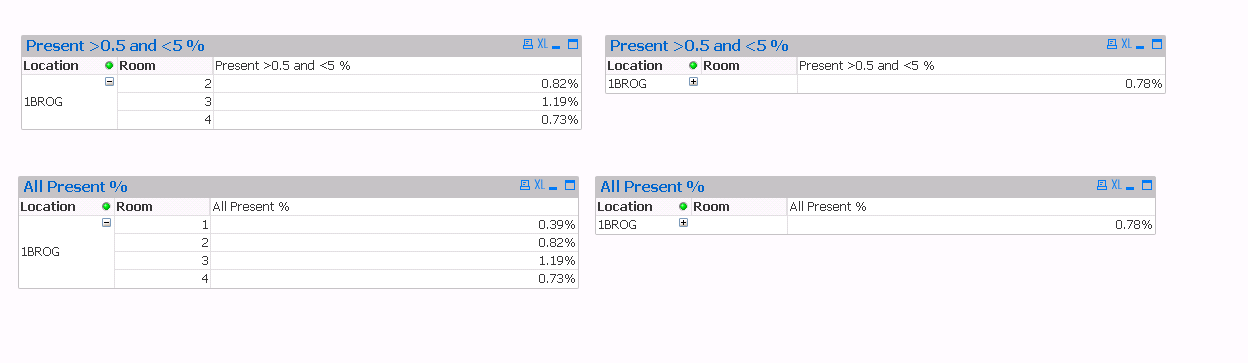
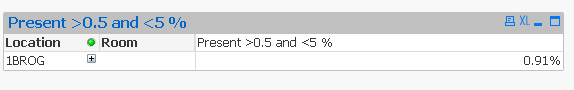
The top 2 charts have the range conditions applied in the expression. The top left chart only shows rooms which have a value within the range of > 0.5 and < 5%. The top right is the same chart but "rolled up". It is showing the sum of the location as 0.78%. However it should show 0.91 which is the average of room 2, 3, 4 percentages.
The bottom 2 charts are without the range conditions. Room 1 is now displayed as it falls outside the range and the chart is showing everything. The bottom right chart is same as the bottom left just "rolled up". It is also showing the value of 0.78% which is correct for this chart as its the average of rooms 1, 2, 3 and 4.
I hope that makes sense.
Also the below expression has the same result as above.
avg(aggr(
if(sum({<[0-7TodayPresentFlag] = {"TRUE"}>}[<7TodayPresent])/sum(People)>0.0005
and sum({<[0-7TodayPresentFlag] = {"TRUE"}>}[<7TodayPresent])/sum(People)<0.05,
sum({<[0-7TodayPresentFlag] = {"TRUE"}>}[<7TodayPresent])/sum(People), Null()),
Room))
Thanks
- Mark as New
- Bookmark
- Subscribe
- Mute
- Subscribe to RSS Feed
- Permalink
- Report Inappropriate Content
Try this:
avg(aggr(
if(sum({<[0-7TodayPresentFlag]={"True"}>}[<7TodayPresent])/Sum(People)*100 < 5
and sum({<[0-7TodayPresentFlag]={"True"}>}[<7TodayPresent])/Sum(People)*100 >= 0.5,
Sum({$<[0-7TodayPresentFlag]={"True"}>}[<7TodayPresent])/Sum(People)),
Location, Room))
- Mark as New
- Bookmark
- Subscribe
- Mute
- Subscribe to RSS Feed
- Permalink
- Report Inappropriate Content
Thank you!