Unlock a world of possibilities! Login now and discover the exclusive benefits awaiting you.
- Qlik Community
- :
- All Forums
- :
- QlikView App Dev
- :
- Re: Chart how to display both label on the right a...
- Subscribe to RSS Feed
- Mark Topic as New
- Mark Topic as Read
- Float this Topic for Current User
- Bookmark
- Subscribe
- Mute
- Printer Friendly Page
- Mark as New
- Bookmark
- Subscribe
- Mute
- Subscribe to RSS Feed
- Permalink
- Report Inappropriate Content
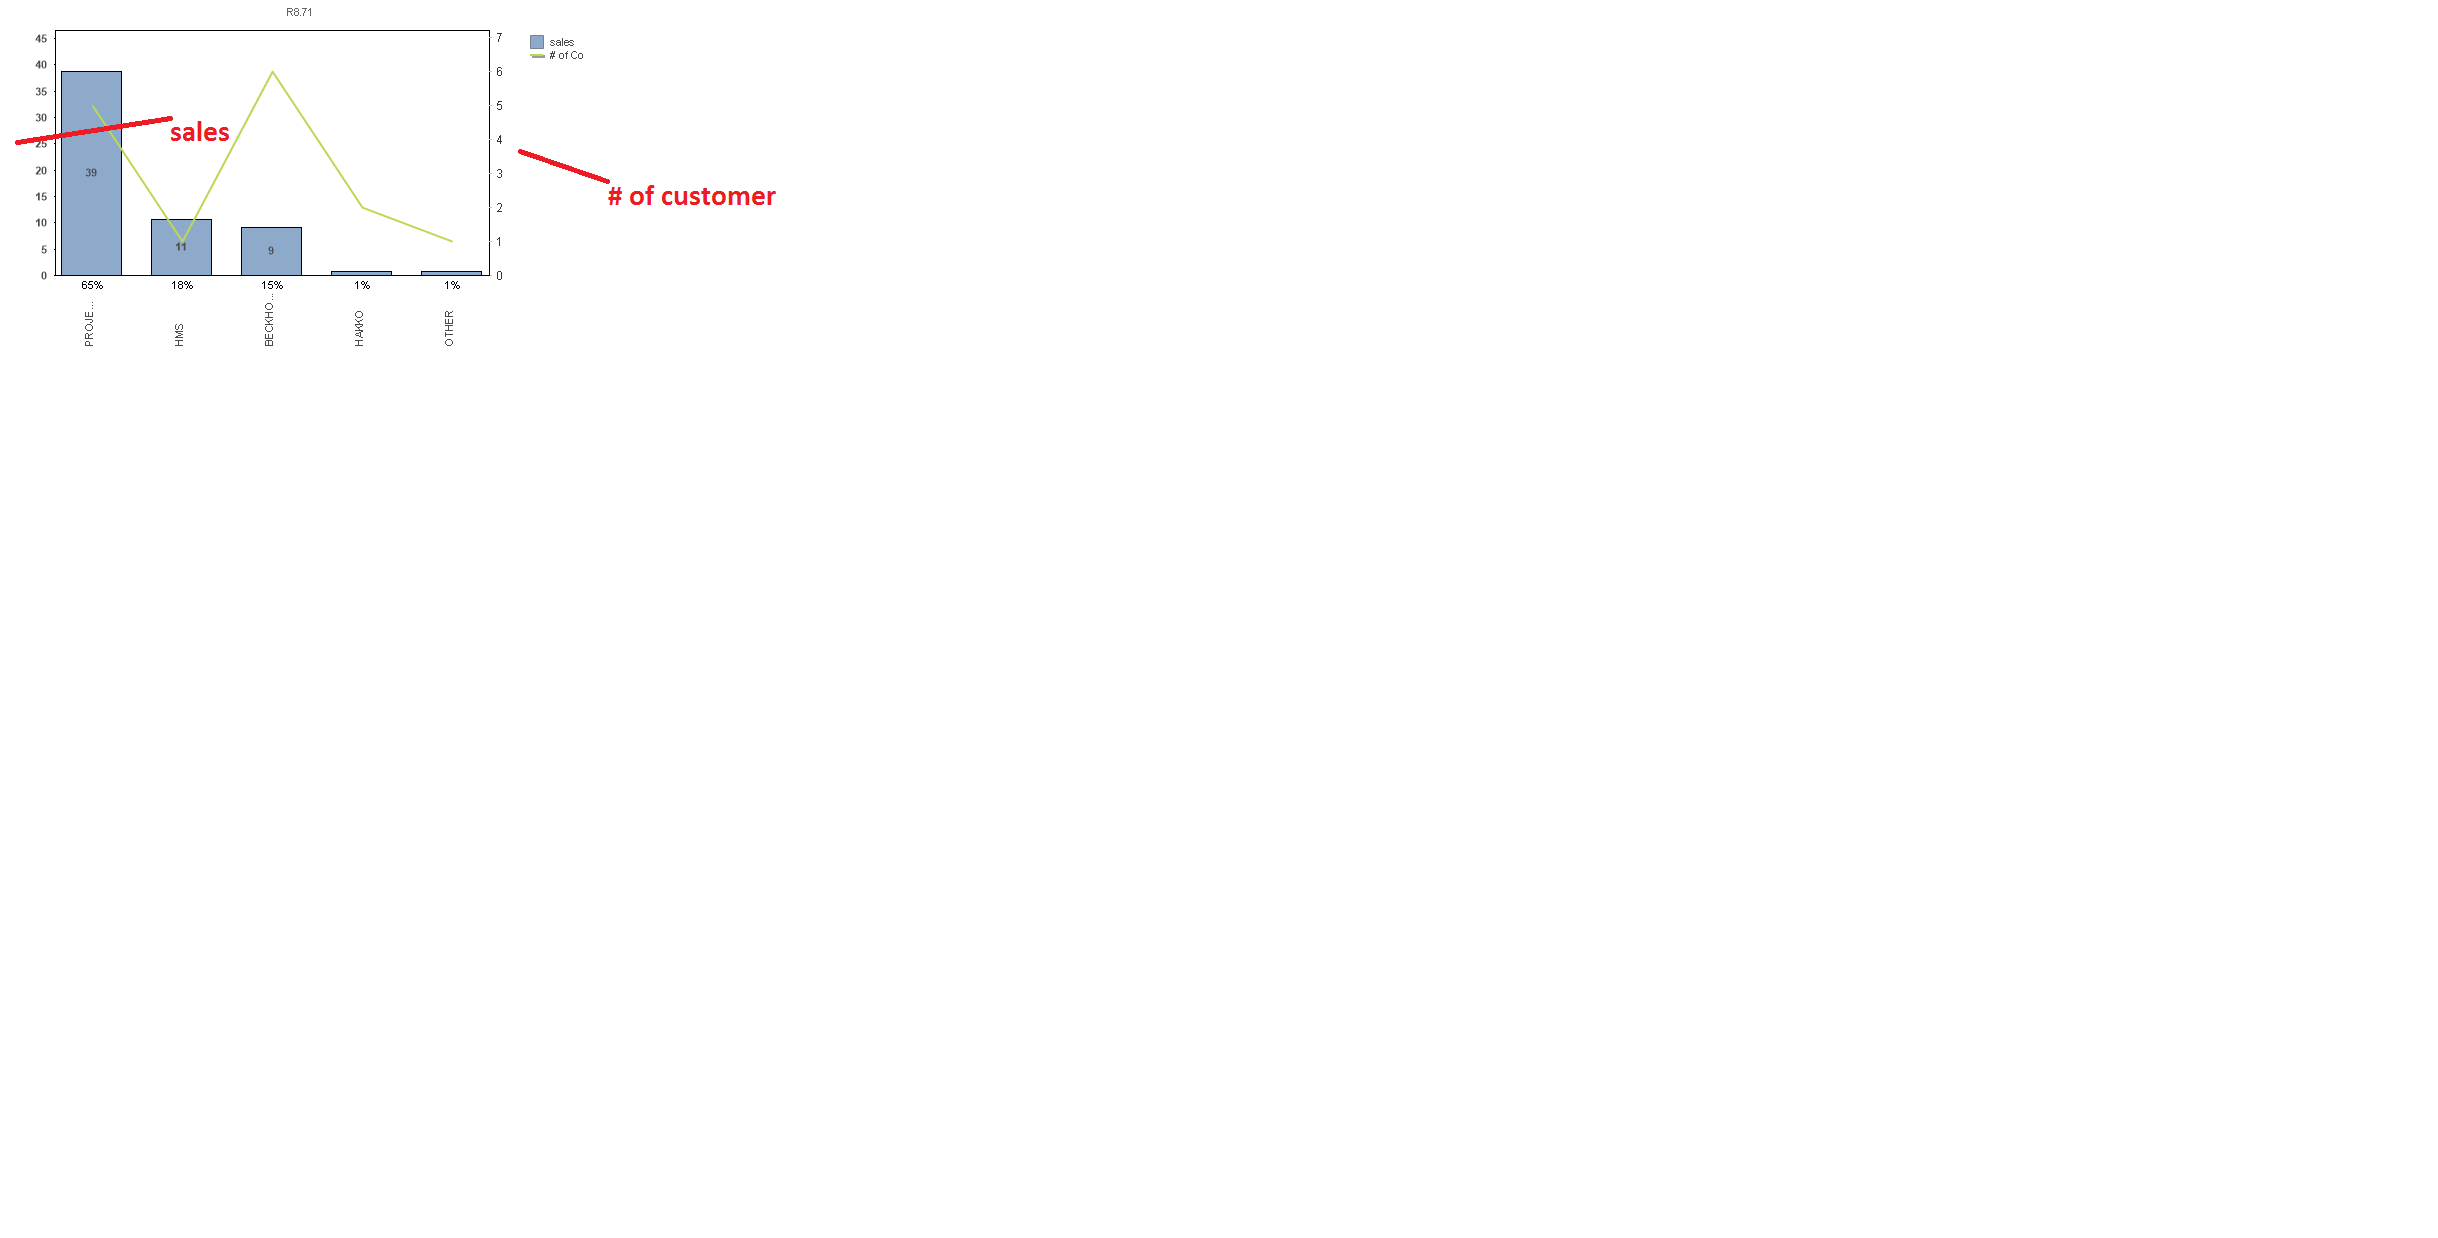
Chart how to display both label on the right and left of Y Axis ?
Hi All
Hope some one can advise me how to achieve the above mentioned.
- Tags:
- qlikview_scripting
- « Previous Replies
-
- 1
- 2
- Next Replies »
Accepted Solutions
- Mark as New
- Bookmark
- Subscribe
- Mute
- Subscribe to RSS Feed
- Permalink
- Report Inappropriate Content
Once you add the text, all you have to do is highlight the chart (Click on the chart). Hold CTRL+SHIFT and you can drag and drop the text.
- Mark as New
- Bookmark
- Subscribe
- Mute
- Subscribe to RSS Feed
- Permalink
- Report Inappropriate Content
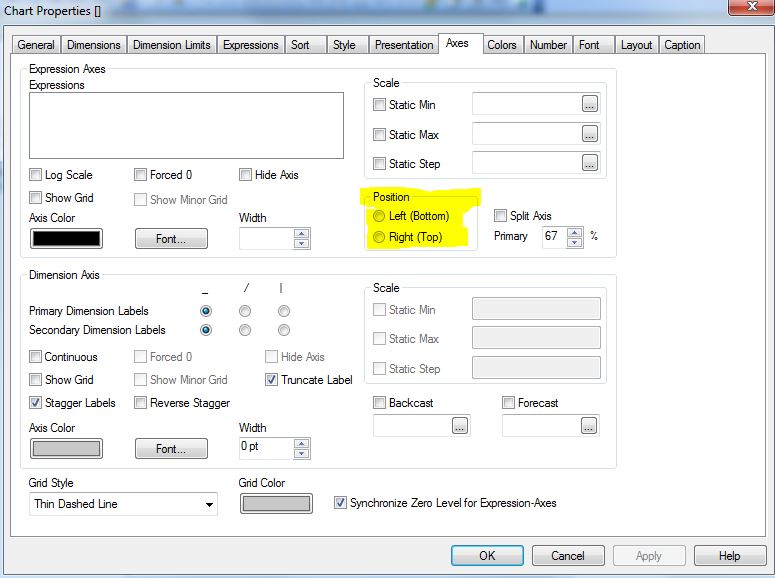
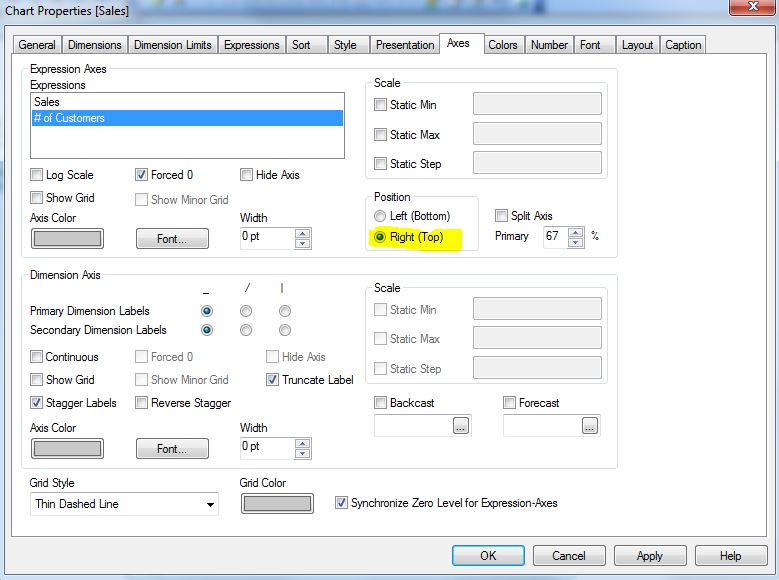
On the Chart Properties, Axes tab, you can set which expressions use the Left or Right Axis in the Position box.
- Mark as New
- Bookmark
- Subscribe
- Mute
- Subscribe to RSS Feed
- Permalink
- Report Inappropriate Content
Hi,
as per your screenshot i think you have to add secondary axis for the metric # of customer then you will get label on both the side. I hope it will help you.
Thanks!
- Mark as New
- Bookmark
- Subscribe
- Mute
- Subscribe to RSS Feed
- Permalink
- Report Inappropriate Content
One way, is by adding Text in Chart in Presentation tab.
- Mark as New
- Bookmark
- Subscribe
- Mute
- Subscribe to RSS Feed
- Permalink
- Report Inappropriate Content
Hi Sir
you are right , but when i type both label in the text box , both label place at same location , how to make it # of customer duispaly at right side ?
- Mark as New
- Bookmark
- Subscribe
- Mute
- Subscribe to RSS Feed
- Permalink
- Report Inappropriate Content
Your chart needs to have 2 expressions, One for Sales, the other for # of Customers.
Then on the Axes tab, select the Sales expression and select the Left Axis in the Position box,
and for the # of Customers expression, select the Right Axis
- Mark as New
- Bookmark
- Subscribe
- Mute
- Subscribe to RSS Feed
- Permalink
- Report Inappropriate Content
Once you add the text, all you have to do is highlight the chart (Click on the chart). Hold CTRL+SHIFT and you can drag and drop the text.
- Mark as New
- Bookmark
- Subscribe
- Mute
- Subscribe to RSS Feed
- Permalink
- Report Inappropriate Content
Hi Sir
I still unable to figure out . enclosed my QV doc.
- Mark as New
- Bookmark
- Subscribe
- Mute
- Subscribe to RSS Feed
- Permalink
- Report Inappropriate Content
Hi Sir
Thank you , it work fine now.
PAul
- Mark as New
- Bookmark
- Subscribe
- Mute
- Subscribe to RSS Feed
- Permalink
- Report Inappropriate Content
ywc
Thanks,
Vinod Kumar V
- « Previous Replies
-
- 1
- 2
- Next Replies »