Unlock a world of possibilities! Login now and discover the exclusive benefits awaiting you.
- Qlik Community
- :
- All Forums
- :
- QlikView App Dev
- :
- Re: Conditional Formatting in Qlikview
- Subscribe to RSS Feed
- Mark Topic as New
- Mark Topic as Read
- Float this Topic for Current User
- Bookmark
- Subscribe
- Mute
- Printer Friendly Page
- Mark as New
- Bookmark
- Subscribe
- Mute
- Subscribe to RSS Feed
- Permalink
- Report Inappropriate Content
Conditional Formatting in Qlikview
Hi Team,
I am new to the Qlik community and this is my first post,also i am new to Qlikview and learning  . please help !!
Need help on Conditional formatting (Color Coding) in Qlikview QVW.
I have a Chart (Pivot Table) in my QVW with some expressions. For example my Expression is "Expression_1" which is a value. now i have a target for this expression lets say the target is "1", now i want to get a color code(Green or Red) with respect to the target.
I can use Visual Cues to achive what i need above BUT,
My targets differ with each Dimension, Please find Example Below.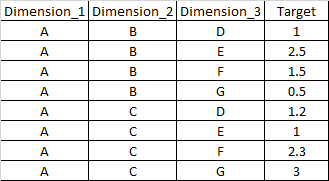
Now i tried using If function in "Background Color" under "Expression_1" and was able to get Color for first condition as below
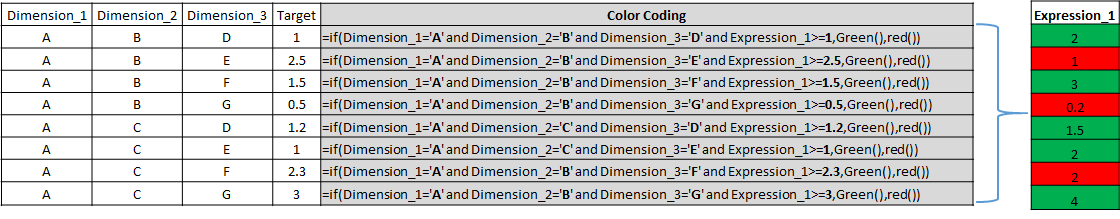
=if(Dimension_1='A' and Dimension_2='B' and Dimension_3='C' and Expression_1>=1,Green(),red())
But what i want to know is HOW i can apply all conditions in one formula and get the color coding.
Your Help is much appreciated, thanks a TON in advance !!
- Mark as New
- Bookmark
- Subscribe
- Mute
- Subscribe to RSS Feed
- Permalink
- Report Inappropriate Content
Hi Varma,
You could check the attachment.
Not sure if it's what you mean..
Grtz. Fred
- Mark as New
- Bookmark
- Subscribe
- Mute
- Subscribe to RSS Feed
- Permalink
- Report Inappropriate Content
Hi Fred,
Thank you so much for your reply.
What you expressed in the document is correct but that applies only for one condition (A,B,E) and rest are Red.
I have targets for other conditions(Each Row) as well and i want to combine all the conditions so that it will get color to Expression_1 accordingly.
I wanted to know how i can combine all conditions and get final color results in Expression_1
Please suggest and let me know if you need further information.
Regards,
Varma.
- Mark as New
- Bookmark
- Subscribe
- Mute
- Subscribe to RSS Feed
- Permalink
- Report Inappropriate Content
I am not strict to IF function alone.That is what i could think of with my knowledge in Qlikview . Please suggest if there any other way to achieve this. thank you !!
- Mark as New
- Bookmark
- Subscribe
- Mute
- Subscribe to RSS Feed
- Permalink
- Report Inappropriate Content
hi Varma,
what's your final chart object is? are you sure it is a pivot table, not a straight one? Is this like
Dim1,Dim2,Dim3, Exp1
if this is a simple straight chart like that, then you can create another table in your date model with a concatenated key autonumber(Dim1,Dim2,Dim3) and Target value. And create the same key in your main table so it will be connected to your color table in data model
Then if your chart dimensions are the same, you can color code now using
if(Exp1 > Target, green(), red())
Now if this is a pivot chart or your dimensions are different, then things can get ugly.
- Mark as New
- Bookmark
- Subscribe
- Mute
- Subscribe to RSS Feed
- Permalink
- Report Inappropriate Content
Look here fo some help about dimensionality
- Mark as New
- Bookmark
- Subscribe
- Mute
- Subscribe to RSS Feed
- Permalink
- Report Inappropriate Content
Hi Varma,
I guess this is what you mean..
Grtz. Fred