Unlock a world of possibilities! Login now and discover the exclusive benefits awaiting you.
- Qlik Community
- :
- All Forums
- :
- QlikView App Dev
- :
- Re: Convert dimension to show lifetime trend
- Subscribe to RSS Feed
- Mark Topic as New
- Mark Topic as Read
- Float this Topic for Current User
- Bookmark
- Subscribe
- Mute
- Printer Friendly Page
- Mark as New
- Bookmark
- Subscribe
- Mute
- Subscribe to RSS Feed
- Permalink
- Report Inappropriate Content
Convert dimension to show lifetime trend
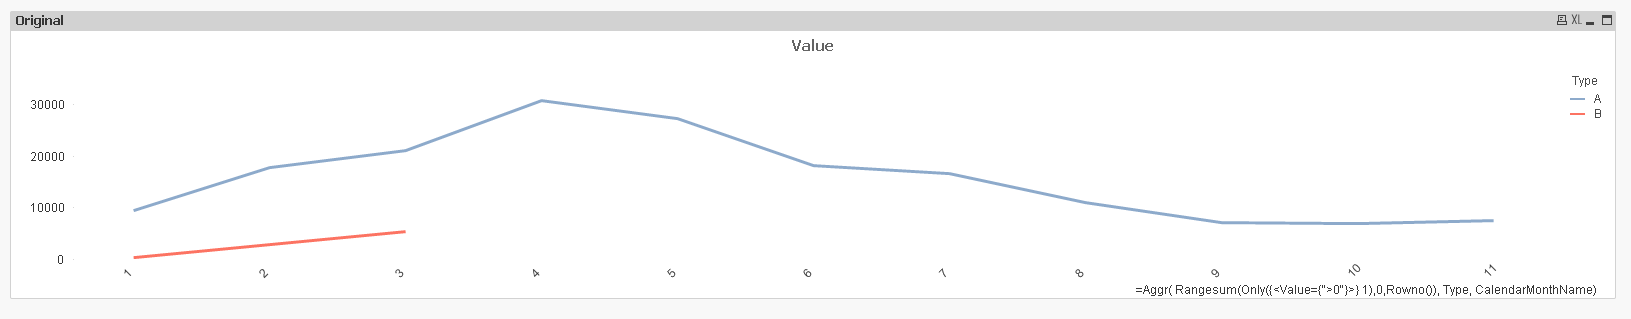
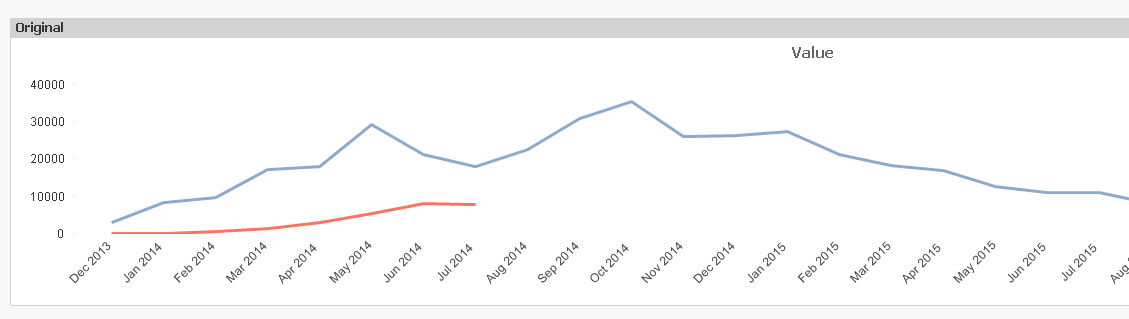
I have a simple line chart with Date as dimension and two expressions. The first expression runs for a longer period than the second (as in the attached example). What I would like to do is show them both starting at the same point under a universal date dimension (for example, month 1, month 2 etc).
I have attached a QVW which highlights this. The first chart displays the current view and the second chart the desired result. I have manipulated the data to get the desired result but would ideally like to get to it by either changing the original chart properties or maybe even the script. Although, a script change may affect the calendar as a whole and other data tables.
I'm not sure if this is possible but am open to any suggestions!
Many thanks in advance.
Mehul
Accepted Solutions
- Mark as New
- Bookmark
- Subscribe
- Mute
- Subscribe to RSS Feed
- Permalink
- Report Inappropriate Content
Or maybe using a calculated dimension that may react on user selections in your calendar fields.
Like
=Aggr( Rangesum(Only({<Value={">0"}>} 1),0,Rowno()), Type, CalendarMonthName)
[using a script Crosstable transformation to create Type / Value fields from your input table]
- Mark as New
- Bookmark
- Subscribe
- Mute
- Subscribe to RSS Feed
- Permalink
- Report Inappropriate Content
Not sure, but something like this?
- Mark as New
- Bookmark
- Subscribe
- Mute
- Subscribe to RSS Feed
- Permalink
- Report Inappropriate Content
Or maybe using a calculated dimension that may react on user selections in your calendar fields.
Like
=Aggr( Rangesum(Only({<Value={">0"}>} 1),0,Rowno()), Type, CalendarMonthName)
[using a script Crosstable transformation to create Type / Value fields from your input table]
- Mark as New
- Bookmark
- Subscribe
- Mute
- Subscribe to RSS Feed
- Permalink
- Report Inappropriate Content
HI both,
Thank you for the quick responses.
Sunny, although this solution does work, I'm looking to have an arbitrary value for the month in order to track lifetime activity.
swuehl, this works perfectly, thanks! I'm not concerned about selections but nice to know there is some flexibility.
Mehul