Unlock a world of possibilities! Login now and discover the exclusive benefits awaiting you.
- Qlik Community
- :
- All Forums
- :
- QlikView App Dev
- :
- Count problem...
- Subscribe to RSS Feed
- Mark Topic as New
- Mark Topic as Read
- Float this Topic for Current User
- Bookmark
- Subscribe
- Mute
- Printer Friendly Page
- Mark as New
- Bookmark
- Subscribe
- Mute
- Subscribe to RSS Feed
- Permalink
- Report Inappropriate Content
Count problem...
hi!
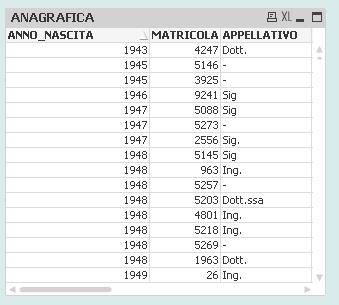
i've got this table and i want to build a graphic that shows how many people were born in each year of the column "ANNO_NASCITA".
When i try to build a graphic i used function COUNT, but the graphic shows me each year of the table... for example i've two slice for the year 1945 !! So what kind of function i've to use to solve this problem??
- Mark as New
- Bookmark
- Subscribe
- Mute
- Subscribe to RSS Feed
- Permalink
- Report Inappropriate Content
Hi,
what do you count? how is your expression?
- Mark as New
- Bookmark
- Subscribe
- Mute
- Subscribe to RSS Feed
- Permalink
- Report Inappropriate Content
Usa come dimensione l'anno di nascita e come espressione:
count(Matricola), dovrebbe funzionare.
Fammi sapere
Ciao
- Mark as New
- Bookmark
- Subscribe
- Mute
- Subscribe to RSS Feed
- Permalink
- Report Inappropriate Content
Can you show your app?
- Mark as New
- Bookmark
- Subscribe
- Mute
- Subscribe to RSS Feed
- Permalink
- Report Inappropriate Content
Do you want to count the people born in a particular year , if that is the case then you must have the names in some column ,
so try this in dimention you will take year in x-axis and expression write : substringcount(Name,Name)