Unlock a world of possibilities! Login now and discover the exclusive benefits awaiting you.
- Qlik Community
- :
- All Forums
- :
- QlikView App Dev
- :
- Re: Creating a Slider
- Subscribe to RSS Feed
- Mark Topic as New
- Mark Topic as Read
- Float this Topic for Current User
- Bookmark
- Subscribe
- Mute
- Printer Friendly Page
- Mark as New
- Bookmark
- Subscribe
- Mute
- Subscribe to RSS Feed
- Permalink
- Report Inappropriate Content
Creating a Slider
Hi Community
I have created a stacked bar chart with Q3 2013, Q4 2013, Q1 2014, Q2 2014, Q3 2014, Q4 2014. on the x Axis showing SLA Costs, IT charges, Dual Running, Implementation and Run Costs. I want to create a slider,in which when I click on Q3 2013 on the slider, the since work is done for 2013 , the bar chart should only show the data from Q4 2013 to Q4 2014. And then when I click on Q4 2013 on the slider, since the work is done for Q3 2013 and Q4 2013, the bar chart should reflect the data from Q1 2014 to Q4 2014 and so on. I mean the same applies to rest of the quarters. And when I click on Q4 2014, since all the work has been done by then, the bar chart should not show any data. So the bar chart should be inversely proportional to the slider. Can any one tell me how to create this in Qlikview?
- « Previous Replies
-
- 1
- 2
- Next Replies »
- Mark as New
- Bookmark
- Subscribe
- Mute
- Subscribe to RSS Feed
- Permalink
- Report Inappropriate Content
And Fred
I am trying to build a graph like this along with the slider. But it is not coming. If you can give me some inputs it will be very helpful

- Mark as New
- Bookmark
- Subscribe
- Mute
- Subscribe to RSS Feed
- Permalink
- Report Inappropriate Content
This is what I've created.
Script follows in a couple of minutes..
- Mark as New
- Bookmark
- Subscribe
- Mute
- Subscribe to RSS Feed
- Permalink
- Report Inappropriate Content
I hope you know what you're doing with FornaxRuncosts etc
The only thing I did was editing you're code 🙂
Grtz Fred
tmp:
LOAD * INLINE [
Q, FornaxRunCost, DualRunning, SLACosts, RocheITCharges, Implementation
" Q3 2013, 10,10,10,10,10", 10, 10, 10, 10, 10
" Q4 2013, 2,2,2,2,2", 2, 2, 2, 2, 2
" Q1 2014, 3,3,3,3,3", 8, 8, 8, 8, 8
" Q2 2014, 4,4,4,4,4", 4, 4, 4, 4, 4
" Q3 2014, 5,5,5,5,5", 5, 5, 5, 5, 5
" Q4 2014, 6,6,6,6,6", 6, 6, 6, 6, 6
" Q1 2015, 7,7,7,7,7", 2, 2, 2, 2, 2
" Q2 2015, 8,8,8,8,8", 8, 8, 8, 8, 8
" Q3 2015, 9,9,9,9,9", 9, 9, 9, 9, 9
" Q4 2015, 10,10,10,10,10", 10, 10, 10, 10, 10
];
mydata:
Load *,
(Qyear * 4) + right(Qsub,1) as Qno,
(Qsub * 3) + right(Qsub,1) as [DurationFornaxRunCost],
(Qsub * 4) + right(Qsub,1) as [DurationDualRunning],
(Qsub * 2) + right(Qsub,1) as [DurationSLACosts],
(Qsub * 5) + right(Qsub,1) as [DurationRocheITCharges],
(Qsub * 6) + right(Qsub,1) as [DurationImplementation],
Qyear & '-' & Qsub as vDurrev,
Qsub & '-' & Qyear as vDuration
;
Load *,
mid(trim(Q), 1, 2) as Qsub,
mid(trim(Q), 4, 4) as Qyear
Resident tmp;
Drop table tmp;
// Do not edit after this line, other than adding new Quarter
Qtemp:
Load * INLINE [
vQno, vQlong
8054, 2013-Q2
8055, 2013-Q3
8056, 2013-Q4
8057, 2014-Q1
8058, 2014-Q2
8059, 2014-Q3
8060, 2014-Q4
8061, 2015-Q1
8062, 2015-Q2
8063, 2015-Q3
8064, 2015-Q4
];
- Mark as New
- Bookmark
- Subscribe
- Mute
- Subscribe to RSS Feed
- Permalink
- Report Inappropriate Content
Oh, and I've changed some of the values to get a bit of a wave in the Line Chart 😉
- Mark as New
- Bookmark
- Subscribe
- Mute
- Subscribe to RSS Feed
- Permalink
- Report Inappropriate Content
Thanks a lot Fred. The graph is coming great. But along with this script, how should I make the slider work. The slider shows time ( Q3 2013, Q4 2013, Q1 2014 and so on.... Basically as I move the pointer in the slider from Q3 2013 to Q1 2014, it should show the implementation as completed.So the implementation part of the graph should disappear. This is an example. And may be, it I move from Q1 2014 to Q4 2014 it should show Implementation and SLA costs as completed and the implementation and SLA costs should dissapear and when the time reduced to Q4 2015, it show no data.So the graph should be inversely proportional to the chart. This is the same thing you have done in your project. If possible, can you give me you inputs on how this will be implemented in my scenario.
Regards
Smriti
- Mark as New
- Bookmark
- Subscribe
- Mute
- Subscribe to RSS Feed
- Permalink
- Report Inappropriate Content
Hi Smriti,
The slider is on vQlong.
Using the slider to select 2013-Q4 in vQlong, the value of vQno will be 8056.
The Charts calculated dimension is
=if(Qno >vQno, vDurrev, null())
means show all Qno > vQno, and Qno is part of your data.
* * *
One improvement to your script, change this:
// Do not edit after this line, other than adding new Quarter
Qtemp:
Load * INLINE [
vQno, vQlong
8054, 2013-Q2
8055, 2013-Q3
8056, 2013-Q4
8057, 2014-Q1
8058, 2014-Q2
8059, 2014-Q3
8060, 2014-Q4
8061, 2015-Q1
8062, 2015-Q2
8063, 2015-Q3
8064, 2015-Q4
];
// To this
Qtemp:
Load Distinct
Qno as vQno,
vDurrev as vQlong
Resident mydata;
This will make sure you have all your quarters available in your Island,
without the need to add new quarters.
Grtz Fred
- Mark as New
- Bookmark
- Subscribe
- Mute
- Subscribe to RSS Feed
- Permalink
- Report Inappropriate Content
Hi Fred,
Thanks for the reply. I tried editing the script. But The graph and the slider is not, how I want. When I move the slider, the vQlong , that is the time ( Q3 2013 etc is getting affected.
As I move the pointer in the slider from Q3 2013 to Q1 2014, it should show the implementation as completed.So the implementation part( which is the blue colour in the graph) of the graph should disappear. This is an example. And may be, it I move from Q1 2014 to Q4 2014 it should show Implementation and SLA costs as completed and the implementation and SLA cost( which is light green colours should dissapear and when the time reduced to Q4 2015, it show no data.So the graph should be inversely proportional to the chart.
I am sending you the file again
This is a client's requirement... And I am finding this really complex.
- Mark as New
- Bookmark
- Subscribe
- Mute
- Subscribe to RSS Feed
- Permalink
- Report Inappropriate Content
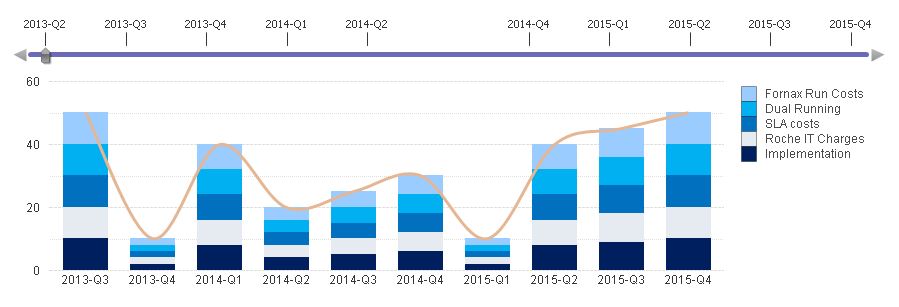
Okay, I believe below is all I can give to you.
Moving the slider to 2014-Q1 makes Roche IT charges disappear.
Values are approx. the values shown in your example.
Grtz Fred
* * * * * * * * * * *
0. Try starting with a new and clean Qlikview file
* * * * * * * * * * *
* * * * * * * * * * *
1. Use this script
* * * * * * * * * * *
tmp:
LOAD * INLINE [
Q, FornaxRunCost, DualRunning, SLACosts, RocheITCharges, Implementation
" Q2 2013, 0,0,0,0,0", 0, 0, 0, 0, 0
" Q3 2013, 10,10,10,10,10", 0, 0, 0, 37, 8
" Q4 2013, 2,2,2,2,2", 0, 0, 0, 37, 18
" Q1 2014, 3,3,3,3,3", 0, 0, 0, 35, 15
" Q2 2014, 4,4,4,4,4", 3, 8, 25, 0, 44
" Q3 2014, 5,5,5,5,5", 4, 8, 25, 0, 45
" Q4 2014, 6,6,6,6,6", 6, 8, 22, 0, 45
" Q1 2015, 7,7,7,7,7", 7, 8, 20, 0, 27
" Q2 2015, 8,8,8,8,8", 10, 8, 18, 0, 22
" Q3 2015, 9,9,9,9,9", 11, 8, 17, 0, 22
" Q4 2015, 10,10,10,10,10", 12, 7, 14, 0, 18
" Q1 2016, 10,10,10,10,10", 15, 5, 8, 0, 17
];
mydata:
Load *,
(Qyear * 4) + right(Qsub,1) as Qno,
(Qsub * 3) + right(Qsub,1) as [DurationFornaxRunCost],
(Qsub * 4) + right(Qsub,1) as [DurationDualRunning],
(Qsub * 2) + right(Qsub,1) as [DurationSLACosts],
(Qsub * 5) + right(Qsub,1) as [DurationRocheITCharges],
(Qsub * 6) + right(Qsub,1) as [DurationImplementation],
Qyear & '-' & Qsub as vDurrev,
Qsub & '-' & Qyear as vDuration
;
Load *,
mid(trim(Q), 1, 2) as Qsub,
mid(trim(Q), 4, 4) as Qyear
Resident tmp;
Drop table tmp;
// do net edit below this line
Qtemp:
Load Distinct
Qno as vQno,
vDurrev as vQlong
Resident mydata;
* * * * * * * * * * *
2. Create your slider on vQlong
* * * * * * * * * * *
* * * * * * * * * * *
3. Create your stacked Bar chart
* * * * * * * * * * *
>> General
- Disable 'Show Title'
- Choose Combo chart
>> Dimensions > =if(Qno >vQno, vDurrev, null())
- Suppress when value is null
- Show Legend
>> Expressions
- label: Implementation > definition: Sum(Implementation) > Display: Bar
- label: Roche IT Charges> definition: Sum (RocheITCharges) > Display: Bar
- label: Sla Costs > definition: Sum(SLACosts) > Display: Bar
- label: Dual Running > definition: Sum(DualRunning) > Display: Bar
- label: Fornax Run Cost > definition: Sum(FornaxRunCost) > Display: Bar
- label: x (remove 'Expressions as Legend') > definition: =sum(FornaxRunCost)+sum(DualRunning)+sum(SLACosts)+sum(RocheITCharges)+sum(Implementation) > Display: Line
By clicking the +-sign next to the label at the left, you can change the Bar Background-color (as definition).
These are the colors I have used:
Implementation: RGB(0,31,94)
Roche IT Charges: RGB(229,235,240)
Sla Costs: RGB(0,112,191)
Dual Running: RGB(0,176,240)
Fornax Run Cost: RGB(155,204,255)
>> Style : stacked
>> Axes : Show Grid and Show minor Grid
>> Caption : Disable Show Caption
- Mark as New
- Bookmark
- Subscribe
- Mute
- Subscribe to RSS Feed
- Permalink
- Report Inappropriate Content
Thanks alot Fred Thankyou so much..It is working perfect. Yesterday it was not working for me because of the excel loaded into qlikview. Today I created a new file which was using your script and it worked great. Thankyou again
- « Previous Replies
-
- 1
- 2
- Next Replies »